Article Text

Abstract
Introduction The Joint Advisory Group on Gastrointestinal (GI) Endoscopy (JAG) biennial census provides a unique view of UK endoscopy. The 2021 census was conducted to understand the impact of ongoing pressures, highlighted in the previous census, as well as COVID-19.
Methods The census was sent to all JAG-registered services in April 2021. Data were analysed across the domains of activity, waiting time targets, workforce, COVID-19, safety, GI bleeding, anaesthetic support, equipment and decontamination. Statistical methods were used to determine associations between domain-specific outcome variables and core demographic data.
Results 321 services completed the census (79.2% response rate). In the first 3 months of 2021, 57.9% of NHS services met urgent cancer waits, 17.9% met routine waits and 13.4% met surveillance waits. Workforce redeployment was the predominant reason cited for not meeting targets. There were significant regional differences in the proportion of patients waiting 6 or more weeks (p=0.001). During the pandemic, 64.8% of NHS services had staff redeployed and there was a mean sickness rate of 8.5%. Services were, on average, at 79.3% activity compared with 2 years ago. JAG-accredited services are more likely to meet urgent cancer waits, with a lower proportion of patient waiting 6 weeks or more (p=0.03). Over 10% of services stated that equipment shortage interfered with service delivery.
Conclusions Services are adapting to continued pressure and there are signs of a focused response to demand at a time of ongoing uncertainty. This census’ findings will inform ongoing guidance from JAG and relevant stakeholders.
- ENDOSCOPY
Data availability statement
Data are available upon reasonable request.
This is an open access article distributed in accordance with the Creative Commons Attribution Non Commercial (CC BY-NC 4.0) license, which permits others to distribute, remix, adapt, build upon this work non-commercially, and license their derivative works on different terms, provided the original work is properly cited, appropriate credit is given, any changes made indicated, and the use is non-commercial. See: http://creativecommons.org/licenses/by-nc/4.0/.
Statistics from Altmetric.com
Summary box
What is already known on this topic
The Joint Advisory Group on Gastrointestinal 2019 census demonstrated that endoscopy services were under continued pressure with increasing demand.
Endoscopy services had developed strategies such as improvements in capacity planning, increased insourcing and staffing to overcome challenges.
What this study adds
The 2021 census gives us a unique view of how endoscopy services are adapting to continued demand, exacerbated by repeated waves of COVID-19.
Levels of activity are not yet back to prepandemic levels and waiting time targets are not being met by most services, however urgent cancer waits are comparable to previous years indicating a focused response and emerging signs of recovery.
There are novel insights into how lists are managed and the impact of equipment shortage on service delivery.
How might it impact on clinical practice in the foreseeable future
These findings will allow new effective strategies to support endoscopy in the face of rising demand, a workforce in flux and limited physical capacity.
Introduction
The 2019 Joint Advisory Group on Gastrointestinal (GI) Endoscopy (JAG) census of endoscopy services highlighted that endoscopic activity was at an all-time high, with services under continued pressure.1 Since then, we have seen a significant change in all aspects of endoscopy provision brought on by the COVID-19 pandemic. The first wave led to cessation of services2 which then adapted to both recover and meet accelerated demand.3 4 Enhanced vetting, risk stratification, adaptive infection control policies and BowelScope cessation (one-off flexible sigmoidoscopy for all 55 years olds) were some ways by which endoscopy services began to recover.5 COVID-19 has also impacted training6 7 and provision of allied services.8
In 2021, the ‘Diagnostics: Recovery and Renewal report’9 and the ‘Getting It Right First Time (GIRFT) report for Gastroenterology’10 were published. These reports have a direct relevance to services’ recovery, highlighting key areas for improvement. Additionally, the launch of the updated Global Rating Scale (a self-assessment quality improvement tool for services) aims to simplify accreditation, taking into account recent changes in endoscopy, such as the pandemic.11 12
This census was developed to look at activity, workforce and waiting times. Considering events of the past 2 years, this census also explores the impact of COVID-19, sessional activity, provision of equipment and decontamination services. This paper reports on the 2021 JAG census and how these data may be used to support effective endoscopy in the UK.
Methods
Study design
A cross-sectional survey study design was used. A question set was developed by the core JAG Quality Group informed by areas of interest. Survey items were reviewed and refined by key JAG stakeholders prior to dissemination (online supplemental file 1).
Supplemental material
Data collection
All UK JAG-registered services were sent the census through an electronic link supported by the SurveyMonkey platform. Reminder emails were sent over a 4-week period. Initial data review identified missing information, and services were subsequently contacted directly to provide these data. Data review ensured no duplication from multiple sites.
Statistical analysis
A case-complete analysis approach was taken. Descriptive analyses were performed as per previous censuses. Categorical data are reported as percentages and numerical data as mean and SD or median and IQR, depending on normality of data (assessed by Shapiro-Wilk method). Outcome variables from each section of the census were analysed against independent variables derived from service-specific core demographic data. Categorical variables were analysed using χ2. Mann-Whitney U and Kruskal-Wallis tests were used to determine differences in continuous outcomes based on grouped data. Variance between continuous variables was performed using one-way analysis of variance (ANOVA) or Friedman’s test.
Statistical significance is indicated by p<0.05 unless otherwise stated. All statistical calculations were performed using IBM SPSS V.25 (Armonk, New York, USA).
Results
Demographics
Overall, 321 services completed the census, with information pertaining to 393 individual units (response rate 79.2%). Table 1 highlights demographic data related to the services who took part.
Demographic information of services who completed the census
There were 47 linked services (14.6%). If services were linked, 100% ran common waiting lists across all sites, 91.5% have the same core staff across all sites and 97.9% have the same policies and audit procedures across all sites.
Activity
Physical space
The median number of endoscopy rooms per site was 2 (IQR 1–3). Regionally, there was significant variability of room number per site (p=0.004). The median number of recovery spaces per room was 3 (IQR 2–4) with no significant difference across site types (p=0.30) or accreditation status (p=0.55). Overall, 51.7% (166/321) of services had fluoroscopy screening rooms with a median of 1 (IQR 0–1) per service. Elective endoscopy occurs outside of dedicated rooms in 30% (97/321) of services. These occur largely in main theatres (50.7%) or radiology (28.2%).
List delivery
Services were asked how lists are delivered within their units across each day. Figure 1 demonstrates the breakdown of when specific procedure types are performed in a typical working day.
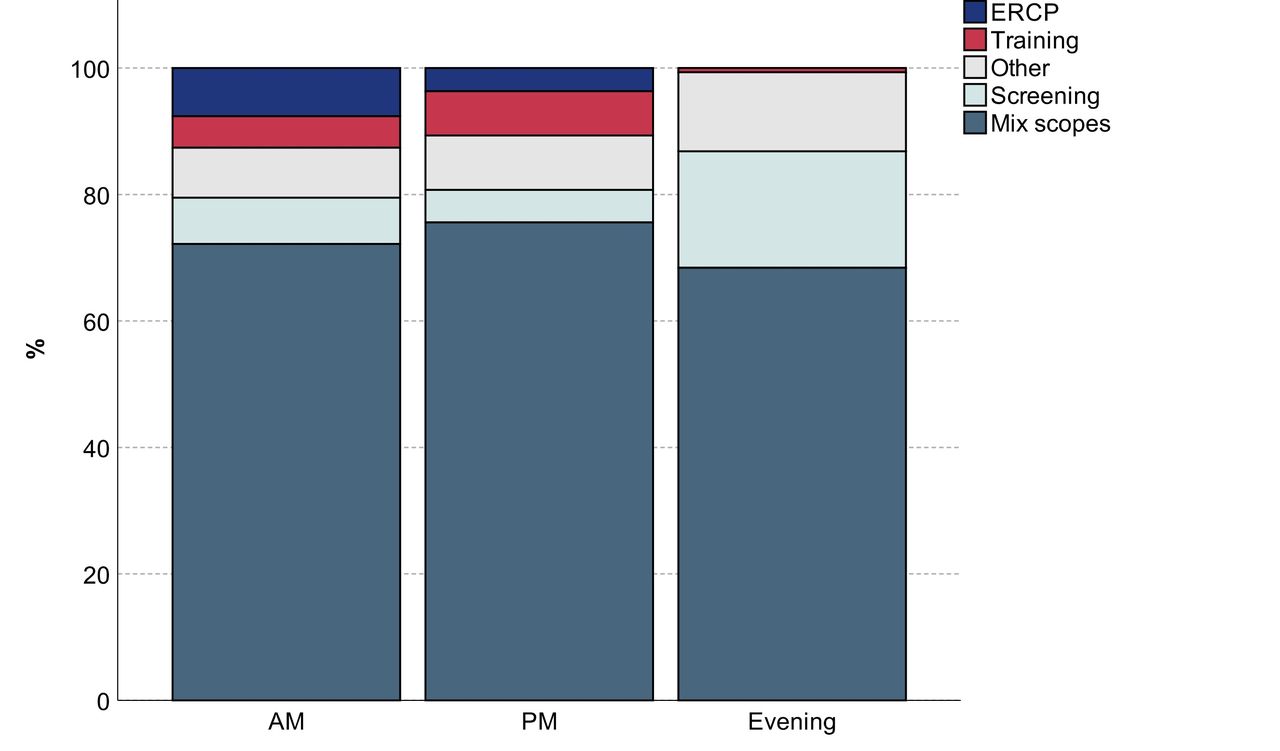
Stacked bar chart demonstrating composition of list capacity (expressed as percentage) throughout day by procedure. ERCP, endoscopic retrograde cholangiopancreatography.
In the month of March 2021, 33 356 lists were delivered across all services—an average of 103.9±96.6 per service and 32.59±17.58 per room. NHS and JAG-accredited services delivered significantly more lists per room than independent sector (p<0.001) and unaccredited services (p=0.03), respectively. There was no significant difference in lists delivered per room across regions (p=0.65).
Additional lists in March 2021 were made up of standard weekend activity by own team (mean 2.4±6.8 per month) and waiting list initiative (WLI) paid activity (mean 8.83±18.3 per month). Between January and December 2020, 52.8% (84/159) of acute services outsourced activity and 45.9% (73/159) insourced (see online supplemental file 2). As part of routine service 52.6% (169/321) of services conduct weekend lists (including WLI). A median of 4 non-GI lists are planned per month per service (IQR 0–12).
Supplemental material
Procedures
A total of 1 533 737 endoscopic procedures were performed in 2020 across all service types. Table 2 shows a breakdown by procedure and site type.
Breakdown of endoscopic procedures performed in 2020
There was no evidence of regional variability in total GI procedure numbers (p=0.69), however JAG-accredited services demonstrated significantly higher procedure counts per room (p=0.002). The percentage of non-GI procedures performed within endoscopy out of all service activity was 5.6% and there was no significant variability between regions (p=0.21).
Supporting patient flow
Out of those services with emergency departments, 16.2% (30/185) stated that their endoscopy unit was used to support emergency admissions, for example, as a temporary escalation area for patients pending discharge home or awaiting a bed. This occurred on average for 28.9±48.4 days in the year.
Workforce
Endoscopists
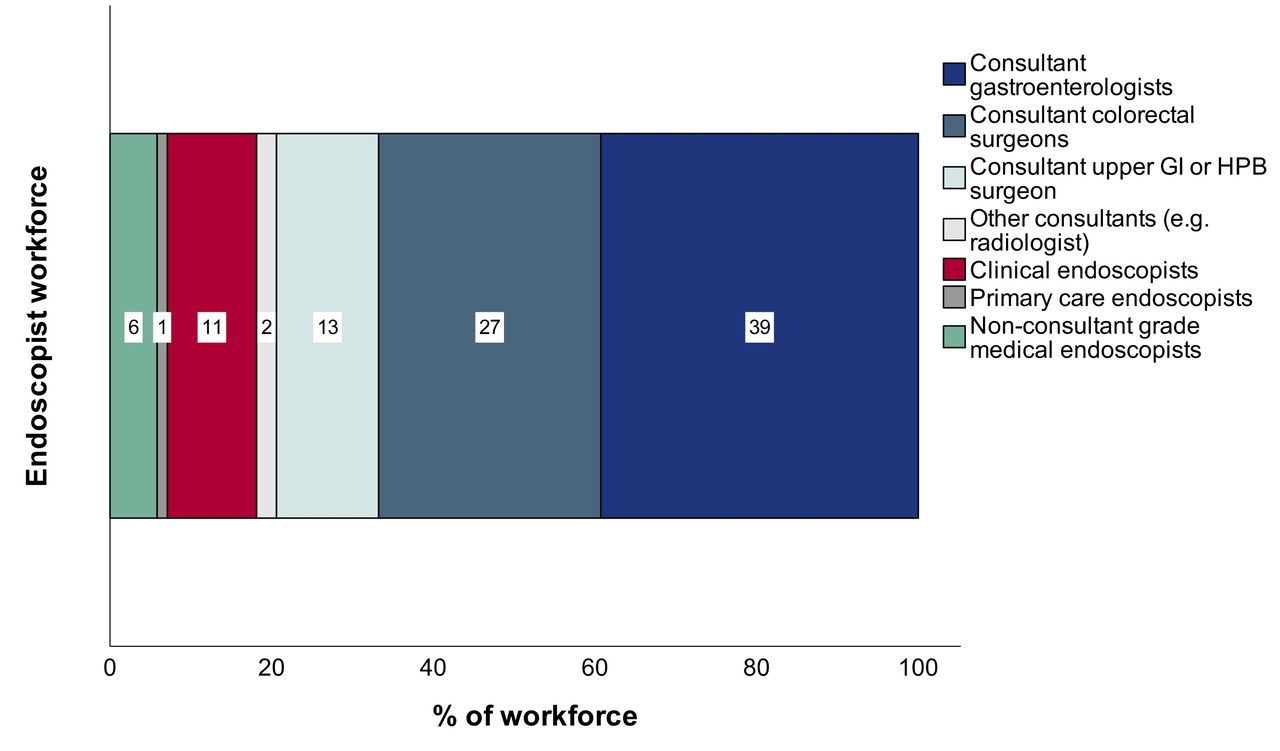
A total of 5973 endoscopists were employed across services. Figure 2 shows the breakdown of endoscopists by role across the entire workforce.

Stacked bar chart demonstrating breakdown of endoscopist workforce by primary role. Numbers displayed within bars represent percentage for each specified role. GI, gastrointestinal; HPB, hepatobiliary.
The annual planned sessions per individual varied across role (range 26.19±22.60–87.00±73.22; figure 3). Clinical endoscopists have significantly greater annual planned sessions per individual than consultant colleagues (pooled ratios, p<0.001).
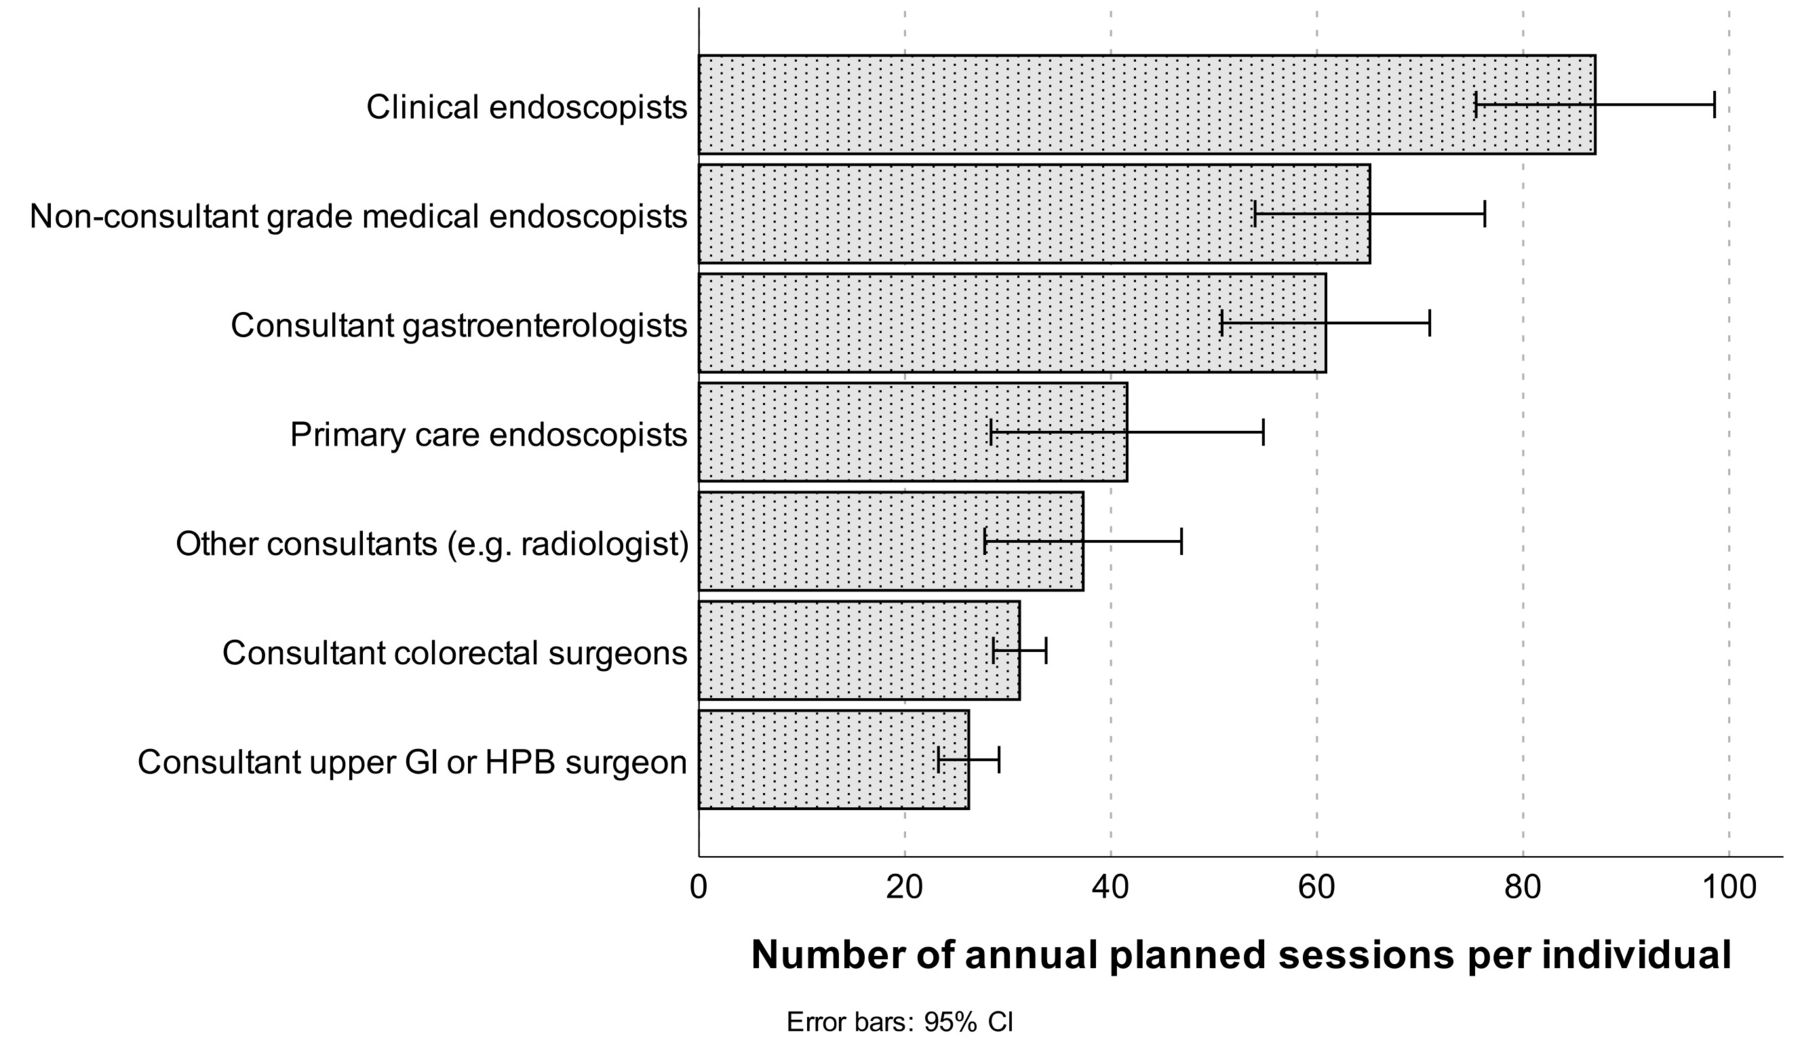
Bar chart of mean number of annual planned sessions per individual per service, defined by endoscopist role. GI, gastrointestinal; HPB, hepatobiliary
Nurses, healthcare assistants and decontamination staff
Table 3 shows the breakdown of number of individuals per service, vacancy rate and percentage absence through sickness in March 2021.
Breakdown of number of nursing, healthcare assistants or decontamination staff per service, vacancy rate and percentage absence through sickness in March 2021
There was a significant difference between vacancy rates (p<0.001) and sickness (p<0.001) among nursing, healthcare assistant and decontamination staff with band 5 staff members having significantly higher rates in both categories.
Administrators
Administration is predominantly provided by a dedicated admin team in 58.3% (187/321) of services, shared with other services in 25.5% (82/321), centralised in 10.6% (34/321) and off-site in 0.6% (2/321). A breakdown of administrators by service and vacancy rates across bands can be found in online supplemental file 2.
Training
Overall, 52.3% (168/321) of services undertake training. A breakdown of service and training provision for trainees can be found in online supplemental file 2. In 2020, 80.4% (258/321) of services had access to training. Training was predominantly affected by COVID-19 (90.7% of services), staffing (45.8%) and funding issues (8.1%). The mean percentage of staff who attended mandatory training per service was 68.6%±36.7%.
Wait times
Targets
Services were asked how often they met waiting list targets over the period January to March 2021. Overall, 57.9% of NHS services met urgent cancer waits, 17.9% met routine waits and 13.4% met surveillance waits. Figure 4 demonstrates differences in wait times across census years. There was an association between JAG accreditation and higher proportion of services meeting urgent cancer waits (χ2(1)=4.57, p=0.03) but not routine (p=0.25) or surveillance waits (p=0.20). Figure 5 highlights the factors cited by services that have contributed to waiting list delays.

Clustered bar chart demonstrating percentage of NHS services meeting waiting time targets over successive census years.
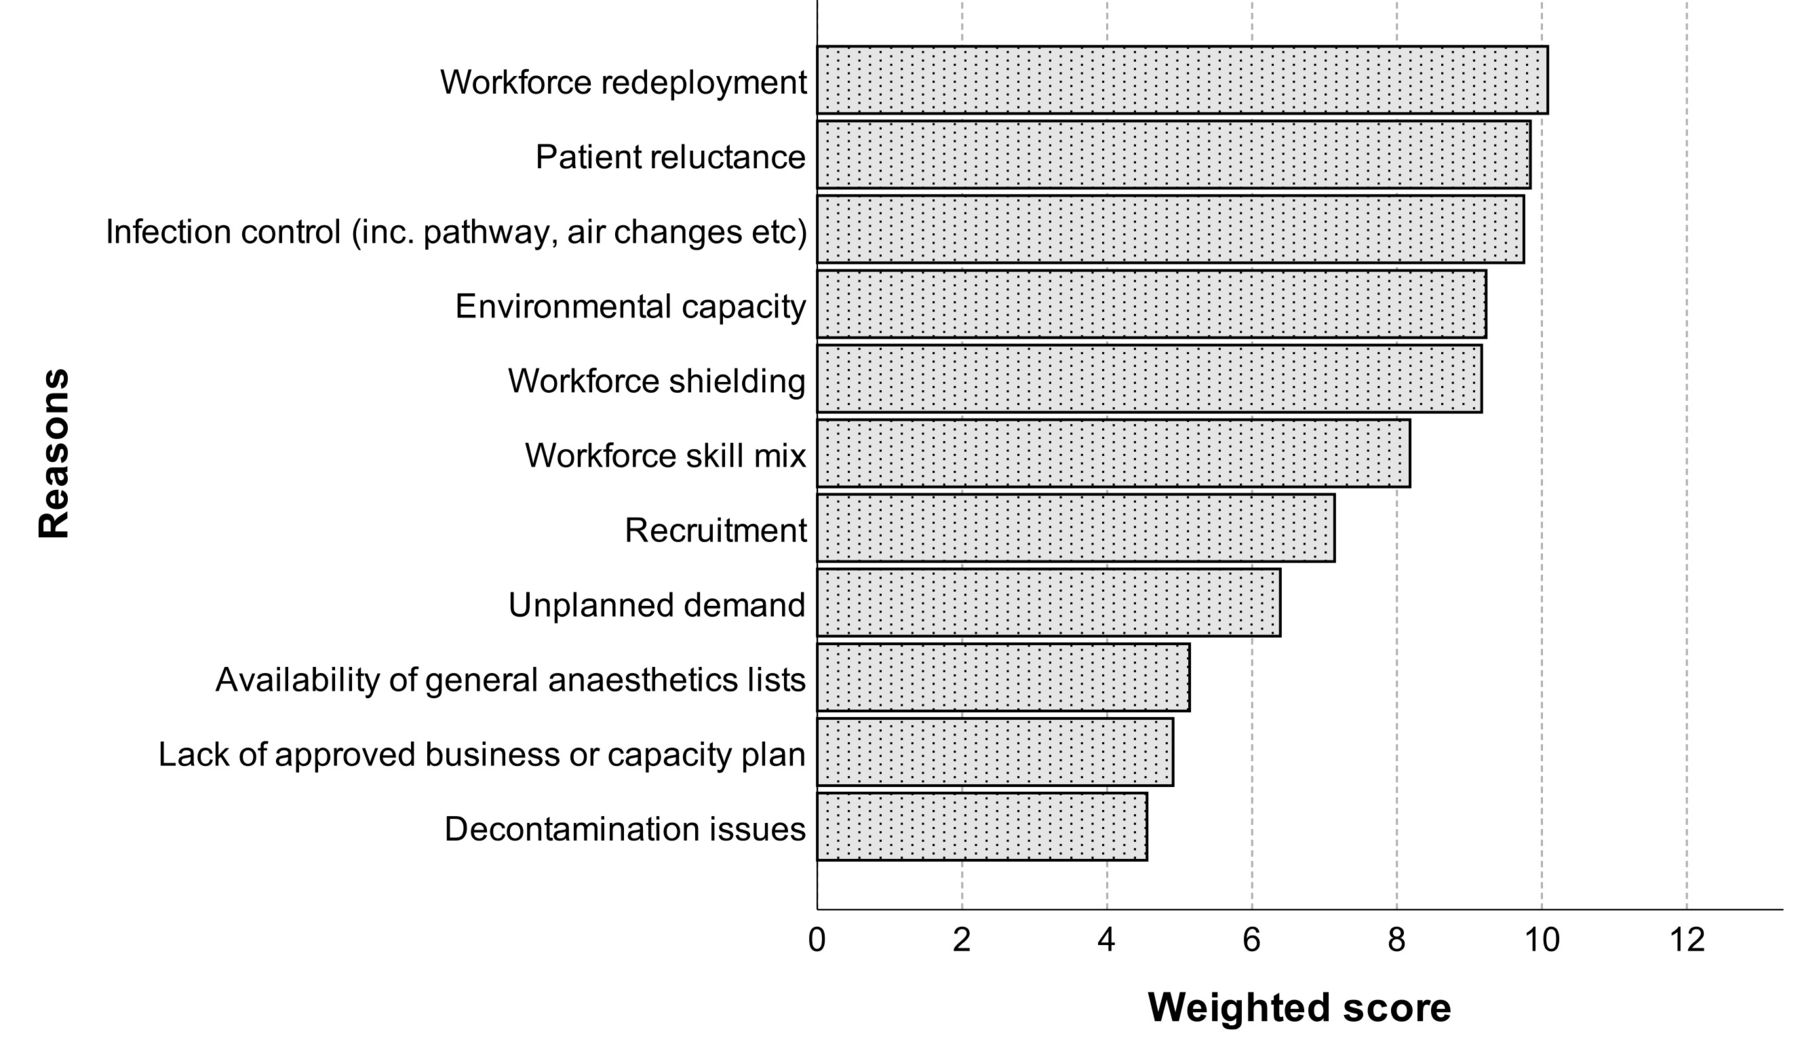
Bar chart showing weighted scores (based on respondent ranking exercise) of reasons for not meeting waiting list targets (in order of highest to lowest scores).
Waiting list numbers
Across the NHS sector, a total of 2 72 497 patients were on waiting lists for endoscopy (mean 1566.1±1694.7 per service). The proportion of patients waiting 6 weeks or more was on average 45.1%±32.0%. JAG-accredited services had significantly lower proportion of patients waiting 6 weeks or more (39.9±32.3 vs 51.1±30.7, p=0.03).
There were also significant regional differences in proportion of patients waiting 6 or more weeks (p=0.001; figure 6) and total number on list (p=0.03) per service. The mean number of patients being added to waiting lists each month was 589.6±492.2 per service; there were no regional differences observed (p=0.07).

Bar chart of proportion of patients waiting 6 weeks or more across regions.
Did not attend (DNA) rates and cancelled procedures
In 2021, there were lower Bowel Cancer Screening (BCS) DNA rates (0.25% vs 1.33%; p=0.001) and higher mean cancelled standard lists (27.9 vs 5.0; p<0.001) than 2019 (online supplemental file 2). There were significantly higher DNA rates and number of cancelled procedures in NHS services (p<0.001). There was no influence of JAG accreditation.
Safety
Overall, 84.7% (272/321) of services had a nominated safety lead. In March 2021, the median number of safety incidents per service was 2 (IQR 1–6) and median number of serious incidents (SIs) was 0 (IQR 0–1). JAG-accredited services had a higher number of safety incidents (p=0.03) but there was no difference observed for SIs. NHS services had a higher number of safety incidents and SI (both p<0.001) than IS services. A rundown of the types of incidents reported can be found in online supplemental file 2.
COVID-19
In this census, we asked specific questions about the impact of COVID-19. Out of 176 NHS services, 38 (21.6%) outsourced endoscopic activity (using own staff) to the private sector between October 2020 and March 2021. A total of 135 (42.1%) services across sectors stated they had staff redeployed with a mean of 44.9%±32.5% (range 1–100) staff redeployed per service. On further review, 64.8% (114/176) of NHS services had staff redeployed compared with 14.5% (21/145) of independent sector services.
Where data were available, there was a mean sickness rate of 8.46%±9.6% between October 2020 and March 2021. There were no significant differences in sickness rate across sectors (p=0.31), regions (p=0.62) or if services were JAG accredited (p=0.31).
In March 2021, there was a mean service activity of 79.3%±20.4% when compared with March 2019. There was no significant difference in activity between regions (p=0.13) but services with JAG accreditation were at a higher percentage activity than unaccredited services (p=0.009).
GI bleed (GIB) and anaesthetic support
Out of the acute services, 86.9% (153/176) had access to GIB cover. Most services either provide this in theatre (70.6%; 108/153), the endoscopy unit (22.2%; 34/153) or via a regional (off-site) service (7.2%; 11/153). From an endoscopist perspective, the GIB rota is predominantly consultant only (81.7%, 125/153) with the remaining services providing either cover including a consultant and trainee (9.8%, 15/153) or consultant and clinical endoscopist (8.5%, 13/153). Endoscopy nurses support the GIB rota in 67.3% (103/153) services.
Anaesthetist-supported lists are provided in 65.4% of services, either on an ad hoc (58.6%, 123/210) or regular basis (41.4%, 87/210). Provision is predominantly 1–3 lists per month (72.9% 153/210).
Equipment
In this census we asked specifically about equipment provision. Table 4 outlines equipment provision in terms of total numbers per service, maintenance and shortage details and age.
Equipment in detail
Between sectors there was a significant difference in percentage of equipment over 10 years of age apart from OGD (p=0.19), stack (p=0.11) and other (p=0.12), with NHS services generally have a higher proportion of older equipment. There was no variability in percentage of equipment older than 10 years across regions or JAG-accredited sites.
Decontamination
The majority of decontamination services are located within the endoscopy unit (62.0%) or sterile services (24.3%). In total, 72.0% of services stated they had capacity to decontaminate more scopes. Furthermore, 42.7% stated that additional building works would be required to increase decontamination by >20% and 58.8% stated that additional reprocessors or dry cabinets would be required to increase capacity by >20%.
Discussion
Activity and waiting Lists
Services are under pressure and remain so. Since COVID-19, waiting times are worse than at similar periods in previous years, to the point where they have attracted mainstream media attention.13 Regional variability is apparent, with some areas performing significantly better than others. However, despite the impact of a second lockdown in early 2021, there are clear signs of recovery. Services are up to an average of 80% activity when compared with 2019 and 20% of services are already matching prepandemic activity. Remarkably, urgent cancer waits in the first 3 months of 2021 were close to levels of previous census years demonstrating clinical focus and prioritisation.
Services are adapting to the mounting pressure of postponed procedures and continued demand. Around 50% of services use insourcing and outsourcing and during the pandemic, 20% of NHS services outsourced activity to the private sector. During this time, national guidance was produced to improve efficiency through stricter vetting, close adherence to clinical guidelines and use of alternative resources.14–16 The GIRFT report has reiterated these as important mitigations.10
List delivery varies regionally but there are common trends noted. Complex procedures, such as endoscopic retrograde cholangiopancreatography, are weighted towards morning and screening procedures towards evening. BCS DNA rates are very low, despite the impact of the pandemic, likely to be aided by dedicated preassessment. It is interesting to note that cancellation numbers for standard procedures are significantly higher than in 2019. Patient reluctance was the second highest reason cited for waiting list issues and was noted to be a significant factor in non-attendance during the early stages of pandemic.17 It may be personal risk of COVID-19 is an ongoing issue, confounded by patient illness and self-isolation.
Workforce and training
Despite the adaptations services have made in response to the pandemic, one continuing issue is staffing. Workforce redeployment was the most cited reason for not meeting waiting list targets. Just over 60% of NHS services reported staff redeployment and within these services, close to 50% of staff were redeployed. Mean sickness rate was 8%, compared with 2.6% in 2019, with no clear variation between sectors or regions. We are yet to see the full consequences of redeployment but there is an early suggestion of associated negative psychological effects.18 The GIRFT report highlighted the importance of staff retention, particularly in addressing nursing turnover rates.10 We identified that the band 5 vacancy rate increased from 13.5% in 2019 to 16.5% in 2021 suggesting a deteriorating position.
Approximately 75% of the endoscopist workforce is made up of consultants but expectedly, clinical endoscopists, who make up 11% of the workforce, have significantly greater number of annual planned sessions per individual. In the coming years, there will likely be a need for a larger and wider pool of endoscopists to deliver activity such as BCS.19 Additionally, the recent gastroenterology workforce report has demonstrated the ongoing deficit in posts with further shortfalls predicted due to retirement and increasing demand.20 The workforce model may have to adapt to overcome these problems, for example, by increasing recruitment and training of non-medical and clinical endoscopists.
COVID-19 has impacted endoscopy training in 90% of services. As a result, only two-thirds of trainees have had access to training and fewer trainees are gaining certification.21 Training issues associated with the pandemic are well recognised and if anything, have led to a renewed focus on improving training. Development of the regional training academies in England is one way to advance the delivery of training and help future workforce development.9 Greater virtual content, updated skills courses, novel training techniques and changes to certification pathways will be used to ensure development of competencies in a timely fashion.22
Capacity and support services
The GIRFT reported highlighted the challenges to some existing services in expanding physical capacity.10 Improvement in infrastructure would also need to include allied processes such as decontamination. Approximately 40% of services would require additional building works to decontaminate more scopes. Close to a third of services perform endoscopy outside of the unit, largely in theatres and radiology, to support complex procedures including those that may require anaesthetic support. Improvements in physical capacity need to consider these areas, potentially incorporating what can be done into the endoscopy unit, for example, X-ray screening or anaesthesia-supported rooms.
Quality standards include the use of newer technologies to improve the quality of the endoscopy that we provide. On average, 15% of OGD scopes and colonoscopes that services use are over 10 years old. In addition, over 10% of services stated that equipment shortage interferes with service delivery.
JAG accreditation
JAG accreditation recognises the services that deliver a high standard of care. Accredited services in this survey deliver more lists and higher number of procedures per room and are more likely to meet urgent cancer waits, with a lower proportion of patients waiting 6 or more weeks. JAG-accredited units had a higher number of safety incidents but no difference in SIs compared with unaccredited units. This may reflect a positive safety culture where incident reporting is embedded into routine care.23 24 Services with accreditation also appeared to reach higher estimated levels of activity post lockdown compared with unaccredited services. Nationally, there may be a drive to increase standards across endoscopy through pursuit of JAG accreditation.
Strengths and limitations
For this census, we adopted a verification method where incomplete initial data from services were chased. This method ensured a higher completion rate than previous censuses and improved data quality. However, as data are self-reported, there is a risk of bias and unreliability. The data received from the census are from either a single time point or period following a second national lockdown and therefore may not be fully reflective of the current practice. Lastly, as in previous censuses, we received less proportionate data from devolved nations affecting generalisability of results.
A key strength of the JAG census is the ability to be responsive to the change and future censuses will endeavour to understand the shifting landscape of endoscopy.
Conclusions
The 2021 census has provided evidence of how endoscopy services are adapting in a time of uncertainty. Findings emphasise the need to optimise endoscopy by providing appropriate use of resource and exploiting alternatives.
Data availability statement
Data are available upon reasonable request.
Ethics statements
Patient consent for publication
Ethics approval
There was no patient involvement and formal ethics approval for this study was not required.
Supplementary materials
Supplementary Data
This web only file has been produced by the BMJ Publishing Group from an electronic file supplied by the author(s) and has not been edited for content.
Footnotes
Twitter @Doc_Wot, @SiwanTG, @SarahTom123, @lapcoleadmark, @AiredaleDodger
Contributors SR, MB, ER, AJ, SM, CH and MC developed and disseminated the Joint Advisory Group on Gastrointestinal Endoscopy census. SR conducted statistical analysis. SR, SM, CH, HA, AD, MC and ST-G developed and revised the manuscript. All authors agreed on the final manuscript version. CH is guarantor responsible for the overall content.
Funding The authors have not declared a specific grant for this research from any funding agency in the public, commercial or not-for-profit sectors.
Competing interests AD is Chair of the Health Security initiative at Flagship Pioneering UK Ltd.
Provenance and peer review Not commissioned; externally peer reviewed.
Supplemental material This content has been supplied by the author(s). It has not been vetted by BMJ Publishing Group Limited (BMJ) and may not have been peer-reviewed. Any opinions or recommendations discussed are solely those of the author(s) and are not endorsed by BMJ. BMJ disclaims all liability and responsibility arising from any reliance placed on the content. Where the content includes any translated material, BMJ does not warrant the accuracy and reliability of the translations (including but not limited to local regulations, clinical guidelines, terminology, drug names and drug dosages), and is not responsible for any error and/or omissions arising from translation and adaptation or otherwise.