Article Text

Abstract
Introduction The 2017 Joint Advisory Group on Gastrointestinal (GI) Endoscopy (JAG) census highlighted the pressure endoscopy services were under in meeting national targets and the factors behind this. In 2019, JAG conducted a further national census of endoscopy services to understand trends in activity, workforce and waiting time targets.
Methods In April 2019, the census was sent to all eligible JAG-registered services. Collated data were analysed through various statistical methods. A further comparative dataset was created using available submissions from the 2017 census matched to services in the current census.
Results There was a 68% response rate (322/471). There has been a 12%–15% increase in activity across all GI procedures with largest increases in bowel cancer screening. Fewer services are meeting waiting time targets compared with 2017, with endoscopist, nursing and physical capacity cited as the main reasons. Services are striving to improve capacity: 80% of services have an agreed business plan to meet capacity and the number using insourcing has increased from 13% to 20%. The workforce has increased, with endoscopist numbers increasing by 15%, nurses and allied health professionals by 14% and clerical staff by 30%.
Conclusions The 2019 JAG census is the most recent and extensive survey of UK endoscopy services. There is a clear trend of increasing activity with fewer services able to meet national waiting time targets than 2 years ago. Services have increased their workforce and improved planning to stem the tide but there remains a continued pressure to deliver high quality, safe endoscopy. In light of the COVID-19 pandemic, JAG recognises that these pressures will be severely exacerbated and waiting time targets for accreditation will need adjustment and tolerance during the evolution and recovery from the pandemic.
- endoscopy
Data availability statement
All data relevant to the study are included in the article or uploaded as supplementary information. Data access for research purposes must be requested through JAG.
This is an open access article distributed in accordance with the Creative Commons Attribution Non Commercial (CC BY-NC 4.0) license, which permits others to distribute, remix, adapt, build upon this work non-commercially, and license their derivative works on different terms, provided the original work is properly cited, appropriate credit is given, any changes made indicated, and the use is non-commercial. See: http://creativecommons.org/licenses/by-nc/4.0/.
Statistics from Altmetric.com
Significance of this study
What is already known on this topic
The last census highlighted the increasing burden on endoscopy services and the areas of workforce, activity and planning that could benefit from improvement.
What this study adds
This census is the first to highlight the trends in activity, workforce and wait times across UK endoscopy services. Our results provide an updated view of how endoscopy services are working and responding to the pressure of increasing demand. Waiting times have worsened and fewer trainee lists are dedicated for training. There are strategies employed by services to counteract this through more capacity planning, increased workforce recruitment and insourcing.
How might it impact on clinical practice in the foreseeable future
The results of the census provide a unique view of the working patterns of endoscopy services nationally. Understanding this helps us to identify areas to improve on in order to ensure services meet standards. Furthermore, services are under unprecedented pressure due to COVID-19 and these results may provide areas to focus on over the coming months.
Introduction
Endoscopy in the UK is in an era of positive change and development. Over the past two decades, we have seen the implementation of quality assurance standards,1–3 national bowel cancer screening programmes,4 5 an electronic certification system6 and novel safety initiatives7 driven by the Joint Advisory Group on Gastrointestinal Endoscopy (JAG).8 The JAG Global Rating Scale (GRS), a quality improvement tool for endoscopy services, has now been used as a blueprint for promoting high-quality endoscopy in the international arena.9 10 Additionally, services can apply for JAG accreditation—if awarded it is a recognition that a service provides high-quality endoscopy, meeting set criteria that incorporate the latest standards from national and international bodies.
However, there are several challenges facing UK endoscopy services. Increased workload is a clear driving force behind this, with previous models predicting up to a 44% increase in activity over 5 years.11 Recognising this, JAG conducted a national census of endoscopy services in 2017.12 This ‘state of the nation’ gave us a clear view of the true burden on services. It demonstrated a significant proportion of services were not meeting waiting time targets, often driven by a lack of workforce and constrained resources.
The census gave us a unique and novel view of the challenges faced by endoscopy services. Building on this, we conducted a further national census in 2019 to identify trends in service delivery and understand the pressures that services face moving into the next decade. This article describes the results of the most recent survey of UK endoscopy services. Since then, at the time of writing, the COVID-19 pandemic is expected to have significant implications for endoscopy services for the foreseeable future. These data may act as a benchmark when services are planning their longer term recovery.
Methods
Study design
Census question items were informed by the previous census, focusing on service activity, waiting time targets and workforce. Questions were created, adapted and reviewed by key JAG stakeholders under the remit of the JAG Endoscopy Services Quality Assurance Group. A final version of the survey was agreed between members before wider dissemination. Survey questions can be viewed in online supplementary file 1.
Supplemental material
Data collection
The biennial census was submitted to all UK JAG-registered services in April 2019. Services were asked to complete and return questions within 4 weeks. Response rates were reinforced by weekly reminder emails. Responses were collated for statistical analysis. Data were collated across services, some including multiple sites. There was no patient involvement and formal ethics approval for this study was not required.
Statistical analysis
Descriptive statistics were performed with categorical data reported as proportions (percentages) and numerical data as mean and SD or median and IQR, depending on normality of data.
Outcome variables (based on question items) were analysed in turn for associations with core demographic data. Categorical data were analysed through cross-tabulation statistics using χ2 or Fisher’s Exact test (where appropriate). The Kruskal-Wallis test was used to determine differences between continuous outcomes. Variance between continuous and ordinal variables was performed using Friedman’s test. Missing data or inapplicable data were excluded from analysis where appropriate.
A comparative analysis was performed comparing the 2017 and 2019 datasets. In order to do this, core variables were identified common to both datasets and filtered by service identification (ID) number to create a comparative cohort. Descriptive statistics were reported as described above. Direct comparison of continuous and dichotomous data over time was performed using the Wilcoxon signed-rank and McNemar tests, respectively.
Statistical significance is indicated by p<0.05 unless otherwise stated. All statistical calculations were performed using IBM SPSS V.25.
Results
Demographics
The response rate was 68.4% (322/471) from eligible services. The responses by country and service type can be seen in figure 1.

Overall response rate of services to census by country and service type. Figures above bars denote number of responses by number of registered services. Acute, services within National Health Service (NHS) hospitals that provide emergency services; independent, services within the independent/private sector; non-acute, services within NHS hospitals with no emergency care, for example, community hospitals.
There were 43 (13.35%) linked assessments (multiple sites within a service). Where known, 44.34% of services were JAG accredited. Across services, the median number of rooms per site per acute service was 3 (IQR 2–4, range 1–12), independent service 1 (IQR 1–2, range 1–2) and non-acute service 1 (IQR 1–2, range 1–9). A total of 150 services met the criteria for comparative analysis (58% were acute, 36% independent, 6% non-acute).
Activity
Procedures
In total, 2 133 541 adult gastrointestinal (GI) endoscopic procedures were performed in one calendar year. The breakdown by service and procedure type can be seen in table 1.
Endoscopic procedures by type
In 2017, there was a per service mean of 5741.74 GI procedures performed increasing to 6625.91 in 2019: a 15.40% increase. Analysis of the comparative cohort revealed a 12.48% increase in total GI procedure numbers (see table 1). The comparative change is displayed in figure 2.
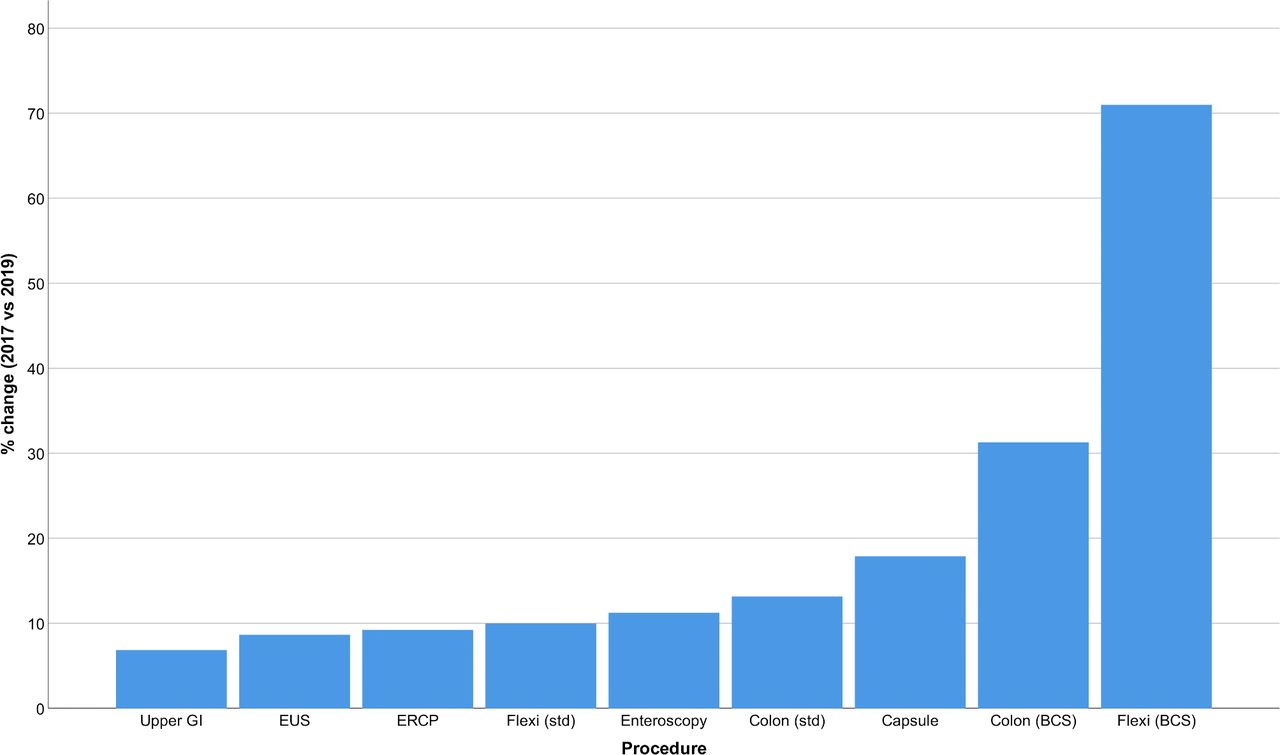
Mean percentage change in gastrointestinal (GI) endoscopic procedure numbers between 2017 and 2019 in the comparative cohort. BC, bowel cancer screening procedure; colon, colonoscopy; ERCP, endoscopic retrograde cholangiopancreatography; EUS, endoscopic ultrasound; Flexi, flexible sigmoidoscopy; std, standard procedure.
List delivery
An endoscopy list is one session of endoscopy activity, that is, half a day. In March 2019, a total of 31 938 lists were delivered across 322 services (mean 99.19, SD 95.71). There were 7006 additional lists made up of 3188 (45.5%) ‘waiting list initiative’ lists (extra lists created to meet demand), 1443 (20.6%) weekend lists run by a local team and 2375 (33.9%) insourced lists (commissioned service from independent providers to operate endoscopy lists on site). Across one calendar year, 17.2% (29/169) of services outsourced activity to external providers and 36.1% (61/169) of services insourced activity. Where known, there was an average of 19.62 lists outsourced and 18.95 lists insourced per month per service. Services employ several methods to enable this (see figure 3).

Contractual methods of outsourcing and insourcing by percentage of total.
There was no significant association of region with outsourcing (p=0.85) or insourcing (p=0.49). Accreditation status had no association with outsourcing (p=0.20) but a significant relationship with insourcing (χ2(1)=15.43, p<0.001), where unaccredited services are more likely to insource. In the comparative cohort, outsourcing activity from 2017 to 2019 reduced from 15.2% to 11.9% (p=0.33) but insourcing increased from 12.6% to 19.9% (p=0.03).
List activity
Services were asked for the number of procedures booked onto routine lists. Oesophagogastroduodenoscopy (OGD) service lists had a median of 10 procedures per list (IQR 10–12); OGD training lists median 8 (IQR 7–8); colonoscopy service lists median 5 (IQR 5–6) and colonoscopy training lists a median of 4 (IQR 3–4).
Supporting patient flow
Across acute services, 13.66% (22/161) of services were used to support patient flow from their emergency departments. The median number of days per year that services supported flow was 12.5 (IQR 3.75–46.75). Supporting patient flow occurred as a response to a major internal or external trust incident on a median of 1 day per year (IQR 1.0–12.0) across all acute services.
Planning
The majority (79.8%) of services have an agreed business plan to meet capacity and demand with 9.9% of services having a 5-year plan. 85.7% of services routinely collect data for demand and capacity. Data for list utilisation are collected per service by 58.1% and per endoscopist by 33.9%. Data for utilisation of points are collected per service by 46.3% and per endoscopist by 25.8%.
Wait times
Services were asked about meeting wait time targets where applicable. Overall, 73.7% (151/205) of services met their urgent cancer wait targets, 68.7% met routine targets (193/281) and 63.4% met surveillance targets (163/257).
Across routine and surveillance targets, there was a significant association with service type, region and accreditation (p<0.001, Fisher’s exact (FE) test). For urgent cancer wait, service type (p=0.002, FE test) and region (p=0.001, FE test) had a significant association but accreditation status did not (p=0.45, FE test). Figure 4 shows the association of country and accreditation status with waiting time targets.
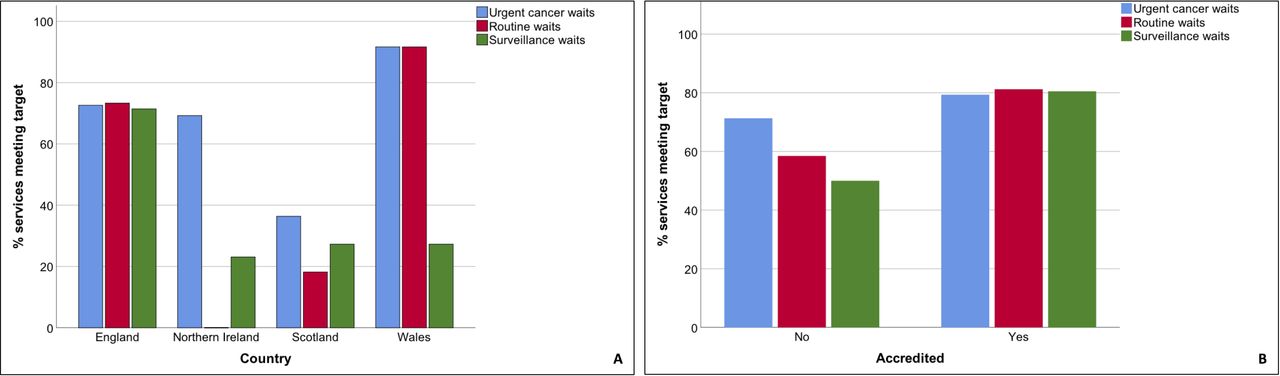
Percentage of services meeting waiting time targets for urgent cancer, routine and surveillance waits by (A) country and (B) accreditation status.
Compared to 2017, the proportion of services that meet targets for urgent cancer has fallen by 7.3%, routine waits 6.0% and surveillance waits 10.0%. Reasons for not meeting waiting times are shown in figure 5 (note, services may have multiple reasons why).

Reasons for services not meeting waiting time targets, by percentage response rate (in order of decreasing frequency).
Did not attend (DNA) and cancellation rates
In March 2019, the mean standard DNA rate was 3.48% (SD 3.07) and mean number of procedures cancelled per month was 5.01 (SD 12.11). There was a significant association of region with standard DNA rates (p<0.001) and service type with both DNA rates and procedure cancellations (p<0.001; see figure 6). Accredited services had a significantly lower mean cancellation number (p=0.049) compared with other services.

(A) Did not attend (DNA) rates defined by services type or county. (B) Number of cancelled procedures per month defined by service type or country. Pairwise statistically significant differences highlighted (*).
There was no difference in standard DNA rates between acute services who undertake BCS and non-BCS services (p=0.51). The mean BCS DNA rate was 1.33% (SD 2.81) and number of BCS procedures cancelled per month was 0.86 (SD 2.39). There was no association of region, service type or accreditation status with BCS DNA rates or procedure cancellation numbers. When comparing standard and BCS lists, there were significantly lower DNA rates (p<0.001) and cancelled procedures (p<0.001) in the BCS cohort.
Workforce
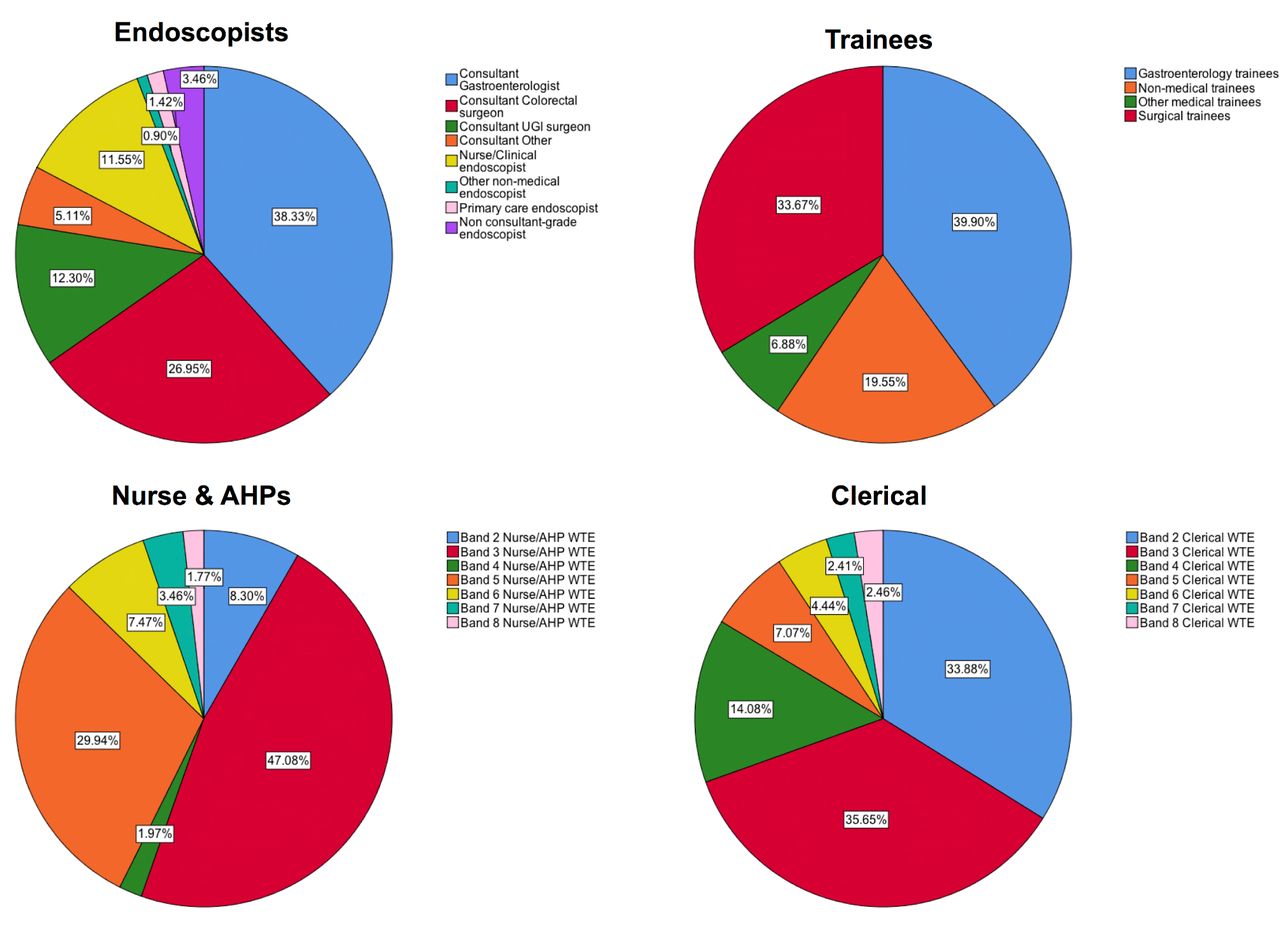
Figure 7 shows the breakdown of the endoscopy workforce by role.

Breakdown of endoscopy workforce by role (AHP, allied health professional, WTE, working time equivalent). UGI, upper gastrointestinal.
Endoscopists
There was a total of 5578 endoscopists employed across all services; the full breakdown of endoscopists by role is shown in table 2.
Breakdown of number of endoscopists by service and session commitment (a session=half day, 1 list or 4 hours)
Between 2017 and 2019, total endoscopist numbers increased by 14.1%. There were significant increases in gastroenterology, colorectal and upper GI consultant endoscopists and nurse/clinical endoscopists in the comparative cohort (see table 2).
Trainee endoscopists
Overall, there were 1350 endoscopy trainees across 169 acute services (mean 7.99, SD 6.97; see table 3). Direct comparative analysis revealed a 28.1% increase in total trainee number between 2017 and 2019.
Endoscopy trainees by specialty including percentage of lists dedicated to training
There is a statistically significant difference in the number of lists per week per trainee (χ2(28)=25.82, p<0.01). Training lists are dedicated lists for trainees, where the number of procedures are reduced. Out of the total number of lists performed by trainees, approximately half (51.93%) are dedicated training lists (see table 3). In 2017, 76% of trainee lists were for training purposes.
Nurses and allied healthcare professionals (AHPs)
There was a total of 12 680 nurses and AHP whole time equivalents across all services (see table 4).
Nurse and allied healthcare professional staffing and vacancy levels
There was a statistically significant difference in vacancy rate between regions (χ2(9)=22.43, p=0.01). London had the highest median vacancy rate (11.69%, IQR 4.14–20.02) and Wales the lowest (median 0, IQR 0–5.99). There was a significant association between service type and vacancy rate (χ2(2)=13.06, p=0.001). Acute services had significantly higher vacancy rates (median 7.42, IQR 3.03–14.77) compared with independent (median 0, IQR 0–20.0; p=0.01) and non-acute services (median 0, IQR 0–9.24; p=0.02). There was no effect of accreditation status on vacancy rate (p=0.29).
The average percentage sickness for March 2019 varied significantly among nursing and AHP roles (χ2(6)=394.14, p<0.001). Band 2 and 5 AHPs and nurses had the highest percentages of sickness reported (per service mean of 4.05% and 5.38%, respectively). The median percentage of days lost through sickness (measured across 1 month) was 7.63% (IQR 0–25.6). The highest percentage of absence through sickness was in band 5 (median 1.28%, IQR 0–6.78). There was a significant difference in sickness based on service type (χ2(2)=60.99, p<0.001), but there was no effect of region (p=0.25) or accreditation status (p=0.09).
In the comparative cohort, there was an overall 13.9% increase in nursing and AHP staff. Significant increases were seen in band 3 (p<0.01), band 5 (p<0.01) and band 7 (p=0.04) grades. There was no significant difference in overall vacancy numbers across bands between 2017 and 2019.
Clerical and admin staff
A total of 1914 clerical staff were employed with 138 vacancies (vacancy rate 6.73%).
Between 2017 and 2019, there has been a 30.09% increase in clerical staff. Significant increases were observed in band 3 (p<0.01) and band 8 (p<0.01) positions.
Discussion
The JAG 2019 census represents the most recent and extensive self-reported survey of activity, workforce and wait times within UK endoscopy. The previous census highlighted how services had difficulty meeting waiting time targets. It appears that this has only been exacerbated in recent times with ability to meet national targets declining across all waiting time types. Over 25% of services did not meet urgent cancer wait targets. There is a clear impact of region on waiting times, with England and Wales performing better. The three most frequent reasons for not meeting targets were endoscopist capacity, physical capacity and nursing capacity.
There is a greater pressure on services with approximately 12%–15% increase in the number of procedures over the past 2 years. BCS procedures saw the largest net increase in our comparative cohort of services but there were also significant increases in standard colonoscopy and capsule endoscopy. The increase in BCS procedures is reflected by the highest level of uptake in recent years with 61.7% of eligible participants ‘attending’ or ‘taking up screening’.13 The further considerable impact of the switch from the faecal occult blood test to faecal immunochemical test on demand for BCS colonoscopies will not have been captured in this census. Some national developments may help curb the flow of increased demand. The new post-polypectomy and post-colorectal cancer surveillance guidelines are predicted to reduce surveillance demand through reduction in the number of inappropriate colonoscopies.14 This will have a cumulative impact over time, potentially reducing demand for surveillance and thereby releasing capacity for screening and symptomatic procedures. The impact of the COVID-19 pandemic will undoubtedly have an, as yet, unmeasured negative impact on meeting demands for endoscopy.
The increasing pressure on services appears to have had a knock-on effect with an increasing pressure on training. Results demonstrate a shift towards fewer training lists in general, with more service-driven training, an effect that is exaggerated by rising numbers of trainee endoscopists. Additionally, the number of lists per week per trainee varies significantly depending on the background of the trainee. This echoes previous studies that highlight the lack of accessible training for surgical trainees15 and differences in list accessibility between trainee types,16 which ultimately may have an impact on competency acquisition.17 Cumulatively, this perhaps signifies a change in how training occurs. We may see this amplified with the advent of ‘Shape of Training’, which will shorten the effective training time for endoscopy within training programmes.18
Our results show that services have been fighting the increasing tide of demand through several sustained changes. An increasing number of services routinely collect data regarding capacity and demand to inform planning. There have been improvements in capacity planning with 79.8% of services having some form of business plan to meet demand, compared with 66% in 2017. Perhaps as a result, there has been a trend towards increased insourcing of lists to overcome the barriers of physical capacity. One inhibitory factor may be the use of endoscopy areas for supporting patient flow, which occurs in 13% of acute services. This may have a negative impact on patient experience, affects physical capacity and is not recommended in current guidance.19 Interestingly, there are significantly lower DNA and cancellation rates in BCS compared with standard procedures, as seen in the previous census. This may relate to differences in the patient population and more dedicated preassessment and preprocedural contact within the BCS programme.
Workforce capacity was previously cited as a barrier to meeting targets.11 12 Our results demonstrate the significant increase in gastroenterologists, surgeons and clinical/nurse endoscopists to meet increasing demand. Concurrently, there has been a 14% increase in the number of nurses and AHPs, with no significant change in vacancy numbers. However, there is close to 8% absence through sickness, with significantly variable levels among different staffing bands and service types. Staff health is important to recognise in the context of increasing workload. The NHS 2018 staff survey identified that 39.1% staff felt unwell as a result of work-related stress.20 Furthermore, a recent national survey of consultant gastroenterologists found that 20% of respondents had experienced significant stress with excessive work as the main contributor.21
JAG accreditation is voluntary, with close to half of all registered services achieving this status. Our analyses demonstrate that accredited services are less likely to insource and have fewer cancelled standard (non-BCS) procedures. Planning and productivity are embedded into accreditation standards so these results are unsurprising.1 JAG accreditation may also influence the training and quality of endoscopy,8 providing added evidence for the benefits of accreditation.
Limitations
The authors acknowledge the limitation of survey-based methods, specifically introduction of bias through non-response. There was a lower response rate compared with the 2017 census which is likely to reflect the change in GRS submission deadlines to being service specific. Accredited services now submit their GRS returns on the anniversary of their initial assessment which may impact on census adherence. Regional low response rates may skew the proportionate data demonstrated, introducing further bias. Despite this, the response rate achieved is thought to be acceptable for reporting of survey outcomes.22 Use of the comparative dataset meant that direct comparisons could be made, but generalisability of results will be limited. For example, the 38% reduction in paediatric endoscopy procedures may not be fully representative of the national picture and could be explained by variations in reporting of paediatric data between censuses, with likely under-reporting of procedures. Lastly, census data are self-reported so data reliability and validity cannot be fully ensured.
Future considerations
Services will need to focus on how to improve productivity in light of the challenges described but also continue to maintain and deliver high-quality endoscopy. JAG provides guidance on how services can work towards this, including support on optimising insourcing, accreditation preparation and workforce development (https://www.thejag.org.uk/JAGguidance). The way we review and respond to quality is already changing with the roll out of the National Endoscopy Database (NED) and greater transparency of key performance indicators.23 Newer metrics, including monitoring of post-colonoscopy colorectal cancer rates, are now integrated within service assessment by JAG.24 25 Future publication will additionally describe safety-specific census data. In the coming year, the update to the GRS will also play a part in how services demonstrate they are meeting and maintaining standards. NED could support future census delivery by increasing procedural data accuracy, thereby overcoming several of the aforementioned census limitations, and providing a clearer picture of endoscopy activity. Lastly, and perhaps most importantly, the effect of COVID-19 on delivery of endoscopy services is unprecedented. There has understandably been a significant fall in total procedure numbers recorded by NED26 and recovery following the pandemic will mean ‘playing catch up’, but this remains a relative unknown at the time of writing.
The census gives us a clear and unique perspective of the continued demand on our endoscopy services and identifies areas to focus on as we respond to newer challenges in 2020.
Data availability statement
All data relevant to the study are included in the article or uploaded as supplementary information. Data access for research purposes must be requested through JAG.
Ethics statements
Patient consent for publication
Acknowledgments
The authors thank the JAG office team for their support in dissemination of the JAG census.
References
Footnotes
Twitter @SiwanTG
Contributors SR conducted statistical analyses and wrote the manuscript with editorial oversight from CJH, JG, HA, AD, MC and ST-G. PB verified statistical analyses. TS, MD, RB, DJ, CJH, JG and ST-G updated and developed question items for the 2019 JAG census. All authors reviewed the final manuscript prior to submission.
Funding The authors have not declared a specific grant for this research from any funding agency in the public, commercial or not-for-profit sectors.
Competing interests SR, CJH, JG, MC and ST-G hold or have held clinical positions at the Joint Advisory Group on GI endoscopy.
Provenance and peer review Not commissioned; externally peer reviewed.
Linked Articles
- UpFront