Article Text

Abstract
Non-alcoholic fatty liver disease (NAFLD) is now the commonest cause of abnormal liver function tests (LFTs) in the UK with approximately a third of the population being affected. The exact prevalence is not known, but population studies from the USA and China using magnetic resonance spectroscopy estimate that approximately 30% of the general population have steatosis. It is a spectrum of disease ranging from simple steatosis, to non-alcoholic steatohepatitis (NASH), through to advanced fibrosis and cirrhosis. The majority have simple steatosis, but approximately 10–30% develop NASH and the development of NASH cirrhosis is associated with a poor long-term prognosis. Patients with NASH have increased liver-related and cardiovascular mortality. Many patients with NAFLD remain undiagnosed, and recognising those at risk is the first step. Clinicians overly rely on abnormal liver enzymes to identify patients with NAFLD, so patients with significant liver disease can be overlooked, potentially missing opportunities for intervention. Although liver biopsy is the gold standard method for diagnosing and staging NAFLD, the majority of patients can be effectively diagnosed non-invasively with tests that are routinely available in the clinic today. This review discusses a pragmatic approach to diagnosis and staging of NAFLD so that patients at the highest risk of liver-related complications can be identified.
- Fatty Liver
- Obesity
- Hepatic Fibrosis
- Staging
- Nonalcoholic Steatohepatitis
This is an Open Access article distributed in accordance with the Creative Commons Attribution Non Commercial (CC BY-NC 3.0) license, which permits others to distribute, remix, adapt, build upon this work non-commercially, and license their derivative works on different terms, provided the original work is properly cited and the use is non-commercial. See: http://creativecommons.org/licenses/by-nc/3.0/
Statistics from Altmetric.com
Introduction
As a result of increasing rates of obesity, non-alcoholic fatty liver disease (NAFLD) is now the most common cause of abnormal liver function tests (LFTs) in the UK.1 NAFLD is present when >5% of hepatocytes are steatotic in patients who do not consume excessive alcohol consumption (<20 g/day for women and <30 g/day for men) and ranges in severity from simple steatosis (fat without significant hepatic inflammation or hepatocellular injury), to steatohepatitis (fat with hepatocellular injury and hepatic inflammation), through to advanced fibrosis and cirrhosis. Although the exact prevalence of NAFLD in the UK is not known, population studies from the USA and China using the most accurate imaging modality for liver fat, magnetic resonance spectroscopy, estimate that approximately 28–31% of the general population have steatosis and 8% have a raised alanine transaminase (ALT) due to NAFLD.2 ,3 NAFLD frequently coexists with other liver diseases such as hepatitis C, haemochromatosis and alcoholic liver disease and has been shown to cause more rapid disease progression.4 Fatty infiltration of the liver can also be secondary to treatment with steatogenic drugs such as tamoxifen, amiodarone and steroids.
Natural history of NAFLD
Up to 90% of patients with NAFLD have simple steatosis, which carries a relatively benign prognosis,5 with no overall increase in mortality.6–8 However, approximately 10–30% have the potentially progressive form of NAFLD, non-alcoholic steatohepatitis (NASH), which is associated with hepatocellular injury and inflammation.6 ,9 ,10 Approximately 25–40% of patients with NASH will develop progressive liver fibrosis, ultimately resulting in cirrhosis in 20–30%.6 ,8 ,11–13
The development of cirrhosis due to NASH is associated with a poor long-term prognosis. The 10-year mortality rate is 20% for subjects with Child-Pugh A disease and 45% will decompensate within 10 years of diagnosis.14 In addition, subjects with NASH cirrhosis are at significant risk of developing hepatocellular carcinoma (2.6% per year).15 It is important to note that, in addition to having an increased liver-related mortality rate compared with a reference population (2.8% vs 0.2%; p=0.04), patients with NASH also have an increased risk of cardiovascular death (15.5% vs 7.5%; p=0.04).8 All NAFLD patients should be advised to lose weight (by diet and exercise) and modify their metabolic risk factors. Patients with NASH have a worse prognosis and should be included in clinical trials of new treatments for this condition.
Risk factors for NAFLD
See table 1.
Risk factors for NAFLD
The metabolic syndrome
Identifying patients with the metabolic syndrome is key to identifying patients at risk of NAFLD. The metabolic syndrome consists of any three or more of the features in table 2.16 Approximately a third of patients with NAFLD have the full metabolic syndrome and >90% have at least one feature.17 The severity of NAFLD is associated with the severity of the metabolic syndrome with NASH and fibrosis being more prevalent in patients with more metabolic risk factors. Insulin resistance is a key mediator that links NAFLD and the metabolic syndrome.
Features of the metabolic syndrome74
Diagnosis and staging of NAFLD/NASH
Clinical features and blood tests
A diagnosis of NAFLD requires that there is evidence of hepatic steatosis on imaging or histology, and other causes of liver disease or steatosis have been excluded.18 NAFLD is usually asymptomatic, so diagnosis usually follows the incidental finding of abnormal liver enzymes or steatosis on imaging. If abnormal LFTs are present, this is usually mildly raised transaminases (ALT> aspartate transaminase (AST)) and/or gamma-glutamyltransferase. However, ∼80% of patients have normal-range ALT levels (males <40 IU/L and females <31 IU/L),2 and even if elevated, the ALT typically falls (and AST may rise) as fibrosis progresses to cirrhosis. ALT values do not correlate with histological findings and are unhelpful in both the diagnosis of NAFLD and determining disease severity.19 ,20 Clinicians overly rely on abnormal liver enzymes to identify patients with NAFLD, so patients with significant liver disease can be overlooked, potentially missing opportunities for intervention. It has been repeatedly shown that 70–80% of subjects with central obesity and 50–80% of patients with type 2 diabetes have evidence of NAFLD on imaging.10 ,21–24 Therefore, a new approach is needed to use metabolic risk factors to identify subjects with NAFLD/NASH rather than relying on liver enzyme abnormalities.
In patients with abnormal LFTs, alternative causes of liver disease (or cofactors) should be excluded, including alcohol excess, drug-induced liver injury, viral hepatitis, autoimmune liver disease, haemochromatosis, coeliac disease and Wilson's disease (in patients <45 years old).25 Autoantibodies are also frequently detected at a low titre in subjects with NAFLD (antinuclear antibody (ANA) ≥1:160 and/or antismooth muscle antibody (ASMA) ≥1:40) and are usually associated with normal IgG levels and do not generally indicate autoimmune hepatitis.26 ,27 Raised ferritin levels are common in NAFLD and usually reflect underlying inflammatory activity or insulin resistance.28 ,29 A transferrin saturation <45% rules out haemochromatosis. If there is uncertainty about the diagnosis of NAFLD, then a liver biopsy should be considered.
The NAFLD Liver Fat Score is calculated using the presence of the metabolic syndrome, type 2 diabetes, fasting serum insulin, fasting serum AST and the AST/ALT ratio (AAR). In a cohort of 470 patients, a score greater than −0.640 predicted NAFLD with a sensitivity of 86% and specificity of 71%. Using cut-off scores of −1.413 and ≥1.257 gave 95% sensitivity for the prediction of NAFLD (with 52% and 51% specificity, respectively).30 However, this score does not distinguish between the different stages of NAFLD.
Imaging assessment of steatosis
Once suspected clinically, fatty infiltration of the liver can be confirmed with imaging. Ultrasonography is widely used as a first-line investigation for hepatic steatosis that provides a qualitative assessment of fatty infiltration of the liver. Ultrasound is very effective in diagnosing steatosis where >33% of hepatocytes are steatotic but can be unreliable with lesser degrees of steatosis.31 Therefore, the finding of a normal liver on ultrasound does not rule out mild fatty infiltration of the liver. Other imaging modalities such as CT or MRI can also detect hepatic steatosis, but they are not routinely used in the assessment of steatosis. MRI and proton magnetic resonance spectroscopy (MRI/1H-MRS) are the most accurate non-invasive measures of steatosis.32 ,33
Controlled Attenuation Parameter (CAP) is a new ultrasound-based technique to measure steatosis simultaneously with assessment of liver stiffness using transient elastography (TE) (discussed below) that is likely to increase in use in coming years. In the largest study conducted to date, CAP accurately detected steatosis (area under receiver operating characteristic (AUROC) were 0.80 for mild, 0.86 for moderate and 0.88 for severe steatosis) independent of fibrosis in 615 patients with hepatitis C.34 However, few patients with NAFLD have been studied, and the diagnostic thresholds have not yet been clearly defined in NAFLD.
Liver biopsy for NAFLD
Although frequently not required for diagnosis, a liver biopsy is the definitive investigation for NAFLD and provides an assessment of hepatic steatosis, hepatocellular injury, inflammation and fibrosis. The presence of hepatocyte ballooning degeneration in association with steatosis is the key histological feature that distinguishes NASH from simple steatosis. The ‘NAFLD activity score’ (NAS) is the most widely used histological grading and staging system for NAFLD (table 3).35 The SAF score (encompassing an assessment of steatosis (S), activity (A) and fibrosis (F)) has been introduced more recently, which may be more accurate in identifying NASH.36 However, the majority of patients with NAFLD can be diagnosed and staged adequately using non-invasive strategies. Liver biopsy should be used for subjects where there is diagnostic uncertainly or if non-invasive staging is indeterminate.37
NAFLD activity score (NAS)34
Differentiating steatosis from steatohepatitis without liver biopsy
Knowledge of whether a patient has simple steatosis or NASH is very important prognostically. Subjects with simple steatosis have a good long-term prognosis with low rates of liver-related morbidity and mortality, and therefore do not require specific liver-related treatment. However, patients with NASH can progress to cirrhosis and therefore should be more actively managed to try and prevent disease progression. Unfortunately there is no widely available simple blood test or imaging modality that can differentiate simple steatosis from NASH. Clinically, the risk of steatohepatitis increases with the number of metabolic risk factors. Seventy per cent of centrally obese patients with hypertension and diabetes have steatohepatitis on liver biopsy.17 Therefore, until effective blood tests are available, metabolic risk factor profiling could be used to identify patients for further investigations. The search for an accurate biomarker of NASH is an active area of clinical research, and there have been some recent advances (see ref. 38 for a comprehensive review).
NASH is associated with increased apoptosis, so serum markers of apoptosis may be valuable in distinguishing NASH from simple steatosis.39 During apoptosis, caspases are activated and cleave various substrates, including cytokeratin-18 (CK-18), a major intermediate filament protein in hepatocytes. Hepatocyte apoptosis releases cleaved CK-18 fragments to the bloodstream that can be detected with an ELISA.40 Studies have demonstrated that the M30 antibody can identify patients with NASH with reasonable accuracy.41–43 Feldstein et al42 showed that the level of plasma-cleaved CK-18 fragments was an independent predictor of NASH with an AUROC for a diagnosis of NASH compared with ‘not’ or ‘borderline’ NASH of 0.83. In that study, cleaved CK-18 fragments were 71% sensitive and 85% specific for NASH at a cut-off of 279 U/L. Another CK-18 assay (M65 ELISA) is available that detects both cleaved and intact plasma CK-18 fragments and as a result is a marker of cell death by apoptosis and necrosis.44 Further validation is required to establish whether this assay is more accurate in differentiating NASH from simple steatosis.44 Although CK-18 is still being evaluated, some units are starting to incorporate this test into investigation algorithms for patients with NAFLD.45
Another potentially interesting biomarker of NASH is the serum marker of matrix turnover, terminal peptide of procollagen III (PIIINP). In a study of 172 patients, PIIINP differentiated between simple steatosis and NASH with reasonable accuracy in patients with both mild and advanced fibrosis (AUROC 0.77–0.82 in patients with F0–2 fibrosis and 0.82–0.84 in patients with F0–3 fibrosis). Moreover, PIIINP was accurate in identifying patients with either NASH or advanced fibrosis (AUROC 0.85–0.87). While this needs to be validated, PIIINP might offer a useful test to identify the highest risk patients for further investigation.46
Non-invasive staging of liver fibrosis
Staging fibrosis is essential in all patients with NAFLD to identify subjects with advanced fibrosis who are at risk of liver-related complications.
Simple non-invasive markers of fibrosis
Hepatocellular dysfunction and portal hypertension result from advancing hepatic fibrosis. This may be reflected in ‘routine’ blood tests such as liver function tests (low albumin), full blood count (thrombocytopenia) and coagulation profile (prolonged prothrombin time). These tests provide an indirect measure of fibrosis and are potentially appealing non-invasive markers of fibrosis as they are inexpensive and are performed in all patients with liver disease. With increasing liver fibrosis the ALT typically falls and the AST remains stable or rises, and as a result the AAR increases and can be a useful simple method of identifying patients with advanced fibrosis. Previous studies identified a cut-off >1 for the AAR as a diagnostic test for cirrhosis.47 However, a lower cut-off of >0.8 is more sensitive in patients with NAFLD.48 In our own study, an AAR <0.8 had high predictive ability to exclude advanced fibrosis (AUROC 0.83, sensitivity 74%, specificity 78%, negative predictive value (NPV) 93%), but its positive predictive ability was limited (PPV 44%).20 Although the AAR is reasonably accurate alone, its accuracy is enhanced when combined with other clinical and biochemical features and as a result is incorporated into other non-invasive scores (see table 4).48 ,49
Simple non-invasive tests for fibrosis
The BARD score (table 4) is a simple test using the body mass index (BMI), AAR and presence of type 2 diabetes mellitus.48 A score <2 has excellent NPV of 95–97%, which reliably excludes advanced fibrosis. However, in a typical NAFLD cohort, a large proportion of patients with mild disease have a score of ≥2 due to obesity and diabetes, which limits its utility in clinical practice.
The NAFLD fibrosis score (table 4; http://www.nafldscore.com/) is a validated scoring system that comprises six routinely measured parameters.49 Advanced fibrosis can be reliably excluded (NPV 93%) using the low cut-off score (<−1.455) and diagnosed with high accuracy (PPV 90%) using the high cut-off score (>0.676).49 These results have been validated in other studies.20 ,50
The FIB-4 score (table 4; http://gihep.com/calculators/hepatology/fibrosis-4-score/), although derived in patients with hepatitis C and HIV coinfection,51 appears to be one of the most useful non-invasive tests for diagnosing advanced fibrosis in NAFLD. For stage 3–4 fibrosis, a score <1.3 has a 90% NPV and a score >2.67 has an 80% PPV, with 72% of patients scoring below 1.3 or above 2.67.50 Other studies have confirmed that the FIB-4 score is slightly better than other non-invasive tests in diagnosing advanced fibrosis in NAFLD, including in subjects with normal range ALT levels.20 ,52 ,53
All these simple non-invasive tests for fibrosis have good NPVs and can therefore exclude advanced fibrosis in patients with NAFLD who have low scores. As they can be calculated in all patients with routine blood tests, they offer an excellent method of identifying patients with mild disease who can be managed in primary care. However, the PPVs for these tests are modest (ranging from 27 to 79%), meaning that clinicians should consider further investigation to look for advanced fibrosis in patients with an intermediate or high score for their chosen test.20
Fibroscan
Fibrotic livers have reduced elasticity due to the deposition of fibrous tissue in the hepatic parenchyma. TE (Fibroscan) gives a ‘liver stiffness measurement’ (LSM) using pulsed-echo ultrasound as a surrogate marker of fibrosis.54 The LSM correlates well with the degree of hepatic fibrosis in a range of liver diseases, including NAFLD.54 ,55 In a study of 246 patients with biopsy-proven NAFLD, TE achieved high AUROCs for the detection of ≥stage 2 fibrosis, ≥stage 3 fibrosis and cirrhosis (0.84, 0.93 and 0.95, respectively) and performed better than a number of simple non-invasive scores in the staging of fibrosis.56 In that study, TE had a high NPV of 96% for ≥stage 3 fibrosis at a cut-off of 7.9 kPa but only modest PPV (52% at 7.9 kPa and 72% at 9.6 kPa). A low LSM reliably excludes advanced fibrosis, but the optimum cut-offs for clinical use are yet to be determined.
However, there are significant limitations to using TE in NAFLD. Results may be invalid in older patients (>52 years) and those with central obesity (BMI >35 kg/m2) or type 2 diabetes.57 For obese patients, the Fibroscan XL probe has been developed that is associated with fewer LSM failures (1.1% vs 16%) than the M probe and was accurate for the diagnosis of ≥F2 fibrosis and cirrhosis (AUROC 0.83 and 0.94, respectively).58 However, even with the XL probe, 10% of patients with a BMI >28 kg/m2 have a difference of ≥2 fibrosis stages between TE and liver biopsy.59
Acoustic radiation force impulse
Another imaging technique that has the potential for the non-invasive assessment of fibrosis is acoustic radiation force impulse (ARFI). This technique uses conventional B-mode ultrasonography to generate an ultrasonic pulse and measure the response of the liver tissue as shear wave velocity.60 The median velocity measured by ARFI increases with the degree of fibrosis.61 In one study of 54 patients with NAFLD, the AUROC for the diagnosis of stage 3 or 4 fibrosis was 0.97.62 Although further validation is necessary, this technique is becoming increasingly available on ultrasound machines and has the potential to stage liver fibrosis at the time of liver ultrasound.
Commercial non-invasive fibrosis tests
The Enhanced Liver Fibrosis (ELF) test is a commercial panel of markers of matrix turnover: tissue inhibitor of matrix metalloproteinase 1 (TIMP1), hyaluronic acid and PIIINP.63 This test performs slightly better than the NAFLD fibrosis score for diagnosing moderate fibrosis (AUROC 0.90 vs 0.86) and severe fibrosis (AUROC 0.93 vs 0.89), but combining the two tests gives an AUROC of 0.93 for moderate fibrosis and 0.98 for severe fibrosis.64
Fibrotest (FT) is a commercial panel of biochemical markers of fibrosis that is widely used in France. In NAFLD, FT can diagnose advanced fibrosis with modest accuracy (AUROCs 0.75–0.86 for stage 2–4 fibrosis and 0.81–0.92 for stage 3–4 fibrosis).65 Using a FT cut-off of 0.30 gives a 90% NPV for advanced fibrosis (sensitivity 77%), and a FT cut-off of 0.70 had a 73% PPV for advanced fibrosis (specificity 98%).65 However, this test is not widely available in the UK.
A pragmatic approach to diagnosis and staging of NAFLD in clinical practice
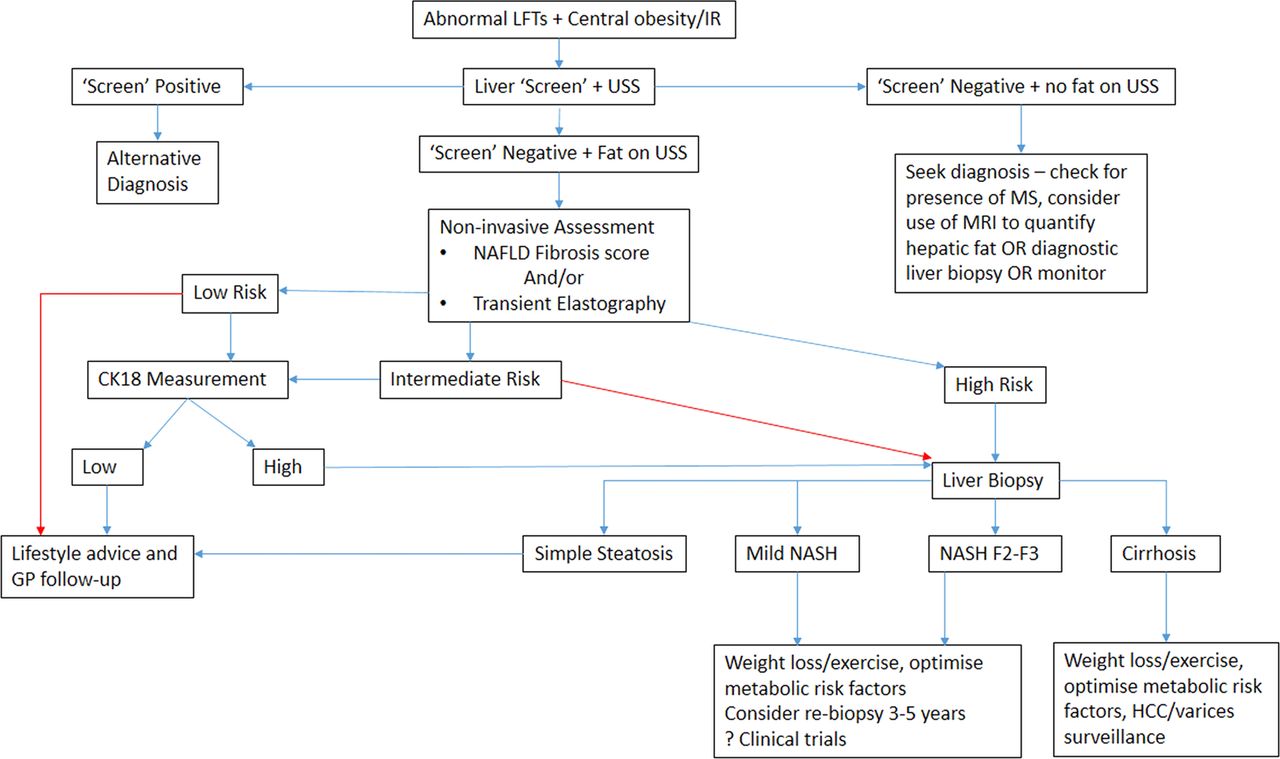
NAFLD is very common and the majority of patients have mild disease, but patients with advanced NASH need to be identified to offer treatment and surveillance for liver-related complications. With the current lack of a simple, widely available biomarker for NASH, a pragmatic diagnostic and staging approach is needed. One such approach for the investigation and assessment of disease severity in patients with NAFLD is shown in figure 1.
Example of algorithm for clinical assessment of patients at risk of non-alcoholic fatty liver disease.36 ,37 ,44 . CK-18 levels are not routinely available in many centres, so patients at intermediate and high risk have to be managed according to the high-risk arm of the algorithm (red arrows). ‘Screen’- blood tests to rule out common causes of liver disease; USS, ultrasound; MS, metabolic syndrome; IR, insulin resistance; HCC, hepatocellular carcinoma.
In brief, the first stage involves the identification of patients with NAFLD either with metabolic risk factor profiling, LFTs or imaging. If steatosis is confirmed and other causes of liver disease are excluded, a clinical diagnosis of NAFLD can be made. The second stage involves risk stratification to determine a patient's stage of disease. This should be initially undertaken non-invasively with a locally available test (eg, FIB-4 score, NAFLD fibrosis score, TE, ARFI, CK-18). Patients who are identified as ‘low’ risk of NASH or advanced fibrosis can be managed in primary care with modification of their metabolic risk factors. Patients who are ‘indeterminate’ or ‘high’ risk should undergo further assessment (often requiring a liver biopsy) to determine the stage of disease. Risk stratification means patients can then be managed appropriately as will be discussed in ‘Non-alcoholic fatty liver disease: a practical approach to management’ by Dyson et al65a.
Machado et al66 have recently proposed a similar algorithm for patients with NAFLD to guide when liver biopsy is needed. They used the NAFLD Fibrosis Score and TE to evaluate fibrosis and CK-18 fragments to evaluate NASH. The management pathway for patients would be very similar as with the algorithm we propose, but CK-18, and even TE, are not available in many centres, which is reflected in our algorithm.66
Conclusions
NAFLD is a very common condition affecting approximately 30% of the population and can cause significant liver disease in a proportion of patients. Accurate diagnosis and staging is important in determining the appropriate long-term management for patients with NAFLD.
Key points
-
Alanine transaminase (ALT) levels are a poor predictor of non-alcoholic fatty liver disease (NAFLD).
-
Ultrasound is the first-line imaging test for patients with suspected steatosis (good accuracy if >30% of hepatocytes are steatotic).
-
Liver fat decreases as fibrosis increases.
-
Risk of NAFLD/NASH directly related to presence and severity of the metabolic syndrome.
-
Simple steatosis carries benign prognosis.
-
NASH carries poor prognosis with increased liver-related and cardiovascular mortality.
-
Aims:
-
to identify individuals at risk of NAFLD
-
to risk stratify patients with NAFLD
-
to focus care on patients with NASH.
-
References
Footnotes
-
Contributors All authors contributed equally to this review.
-
Competing interests None.
-
Provenance and peer review Not commissioned; externally peer reviewed.