Article Text

Abstract
Introduction The Joint Advisory Group on Gastrointestinal Endoscopy (JAG), hosted by the Royal College of Physicians, London, oversees the quality assurance of endoscopy services across the UK. Additional questions focusing on the pressures faced by endoscopy units to meet targets were added to the 2017 annual Global Rating Scale (GRS) return. This provides a unique insight into endoscopy services across all nations of the UK involving the acute and non-acute Nation Health Service sector as well as the independent sector.
Methods All 508 services who are registered with JAG were asked to complete every field of the survey online in order to submit their completed April 2017 GRS return.
Results A number of services reported difficulty in meeting national waiting time targets with a national average of only 55% of units meeting urgent cancer wait targets. Many services were insourcing or outsourcing patients to external providers to improve waiting times. Services are striving hard to increase capacity by backfilling lists and working weekends. Data collection was done in most units to reflect productivity but not to look at demand and capacity. Some of the units did not have an agreed capacity plan. The Did Not Attend rates for patients in the bowel cancer screening programme were much lower compared with standard lists.
Conclusion This review highlights the increased pressure endoscopy services are under and the ‘just about coping’ situation. This is the first published overview of different aspects of UK-wide endoscopy services and the future challenges.
- endoscopy
This is an open access article distributed in accordance with the Creative Commons Attribution Non Commercial (CC BY-NC 4.0) license, which permits others to distribute, remix, adapt, build upon this work non-commercially, and license their derivative works on different terms, provided the original work is properly cited and the use is non-commercial. See: http://creativecommons.org/licenses/by-nc/4.0/
Statistics from Altmetric.com
Summary box
What is already known on this topic
The demand for gastrointestinal endoscopy has increased greatly for both symptomatic patients and bowel cancer screening; overall demand has doubled in many UK centres over the last 5 years.
This has inevitably placed a greater pressure to meet national waiting time requirements.
What this study adds
This survey of all 508 Joint Advisory Group on Gastrointestinal Endoscopy registered endoscopy units demonstrates these pressures and shows the actions they are taking.
Many services are not meeting national waiting time targets. For example, 20% Acute National Health Service (NHS) units in England, 64% units in Northern Ireland, 40% units in Scotland and 42% in Wales failed to meet urgent suspected cancer targets.
Shortages of endoscopists and nursing staff were cited as the biggest barrier that prevents units meeting the demand. Services have introduced extended working hours during the week and at weekends to increase capacity; 66% of acute NHS units do lists most or every weekend.
Many NHS services are paying for ‘insourcing’ in their unit as well as ‘outsourcing’ patients to other services; both are used by approximately 25% of acute English units.
Summary box
How might it impact on clinical practice in the foreseeable future
This is the first published overview of all endoscopy services in the UK including both the NHS and independent sectors.
It provides a unique insight into the pressures that are being experienced and is therefore a useful reference text when capacity planning.
Apart from service expansion and the recruitment and retention of staff, there is the need for a greater focus on productivity and efficiency.
Introduction
The Joint Advisory Group on Gastrointestinal Endoscopy (JAG) accreditation quality assurance standards provide a framework of requirements to support endoscopy services deliver high-quality patient-centred care and assess services for accreditation.1 2 In 2005, the Global Rating Scale (GRS) was developed to improve quality of endoscopy following poor outcomes in the national colonoscopy audit just prior to the start of the National Bowel Cancer Screening Programme in England.3 4 The GRS is used by services to self-assess themselves against measures that cover clinical quality, quality of patient experience, workforce and training.5 6 Since the implementation of the GRS, it has achieved major success by raising standards7 and is now receiving international attention.8–10 Several studies demonstrate the positive impact of JAG on quality of care and training over the last decade.11 12 Currently, the GRS is in place in 508 services in the NHS and independent sectors, with 241 English services holding full JAG accreditation in January 2018.2 JAG accreditation of services is currently voluntary. The aspiration is that the numbers of units with full JAG accreditation will increase as a result of levers such as the Best Practice Tariff for endoscopy services in England and the Welsh Assembly’s national policy.
Since April 2015, additional questions have been added to the GRS return to provide further insight into endoscopy services across all nations and sectors of the UK. The April 2017 survey focused on the pressures that services are under from increasing demand for endoscopy and how they are attempting to cope. This is the most comprehensive survey of UK wide endoscopy services to our knowledge. Nationwide GRS survey results for the last 3 years can be found in the following hyperlink: https://www.thejag.org.uk/AboutUs/DownloadCentre.aspx
Methods
All 508 services registered with JAG were asked to complete the survey online by the end of April 2017. It was attached to the GRS return and had to be completed in order to submit the GRS. All fields were mandated so each question had to be answered. An initial email was sent out to all services towards the end of March 2017 stating that there was a month for the GRS survey to be completed. A reminder email was also sent out in the middle of April and on the deadline permitting two additional weeks to complete the census. Only units who had fully completed the survey were included. Six units who partially responded (three from independent sector and three from Wales) were therefore not included in the analysis. The results were initially analysed using Microsoft Excel 2010 by the Head of Strategic Analysis, Royal College of Physicians London and then converted into this manuscript by the authors. Statistical calculations were performed using the Statistical Package for the Social Sciences (SPSS V.23.0). We performed Pearson χ2 test to assess the statistical significance of our data. Ethics approval was not required to do this survey.
The full survey questionnaire is provided as online supplementary appendix.
Supplementary file 1
Results
The overall response rate was 484/508 (95%). The results per country/sector is given in figure 1.
Figure 1 summarises JAG survey response rate from all endoscopy services across UK in April 2017. The results from the survey have been analysed per nation and sector. The findings are summarised below.

JAG survey response rate across UK: April 2017. JAG, Joint Advisory Group on Gastrointestinal Endoscopy.
Number of procedures performed in 2016
The number of endoscopic procedures, both gastrointestinal and non-gastrointestinal, performed during 2016 (1 January–31 December) is summarised in table 1.
Number of procedures undertaken during 2016 in endoscopy services (rounded to nearest 1000 procedures, blank squares have <1000 procedures performed)
Endoscopy units
The median number of endoscopy rooms in services was three (IQR 2–4) with the acute English NHS sector having the greatest number of rooms compared with other nations. Six per cent (13/215) of its services had six procedure rooms and 2% (5/215) units had seven rooms. Ninety-one per cent (195/215) of acute NHS endoscopy services in England are housed in dedicated ‘standalone’ facilities or part of a multisite facility where 95% of their nurses work only in endoscopy (ie, not shared with day surgery and so on) and 65% have their own decontamination staff (figure 2). Elsewhere in the UK, there are a proportionately greater number of endoscopy services that are integrated with day surgery or in main theatres that include 45% (5/11) in Northern Ireland, 33% (14/43) in Scotland, 19% (4/19) in Wales and 56% (90/162) in English independent sector units. Figure 2 summarises the types of endoscopy facility operated in various sectors.
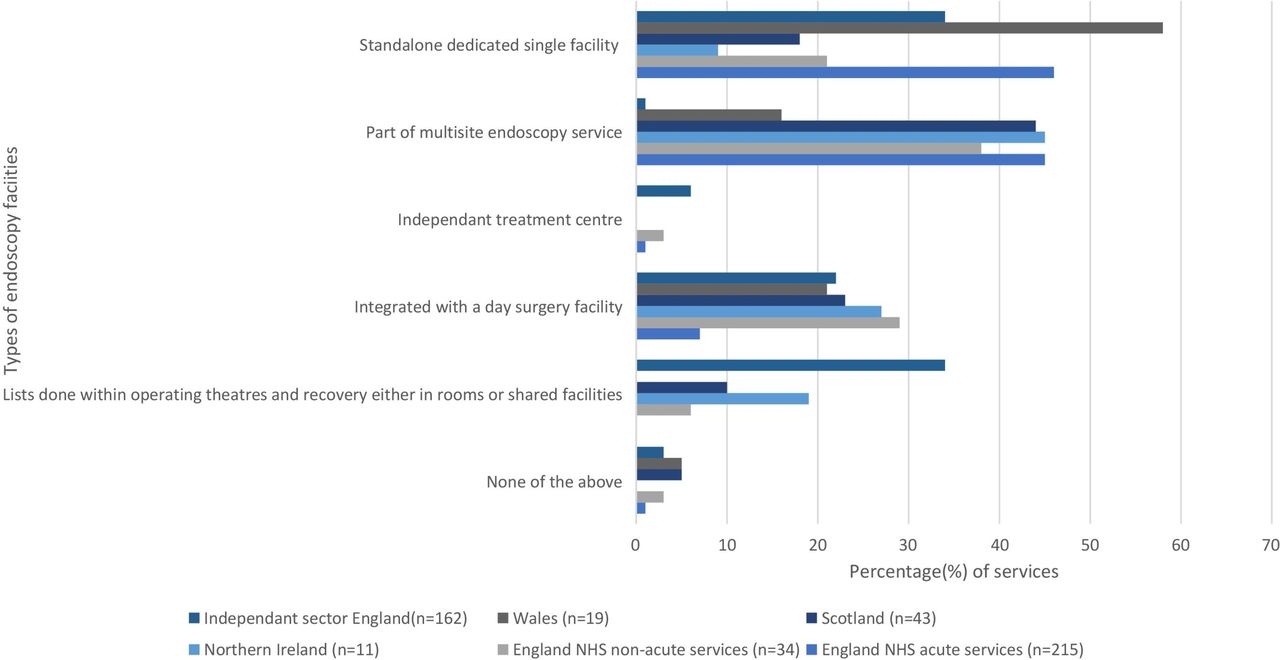
Overview of the types of endoscopy facilities across UK. NHS, National Health Service.
Staffing
The number of endoscopists employed at the time of the survey is summarised in table 2. It must be noted that some of the endoscopists work both in NHS and independent sector.
The vacancy rate for endoscopy nurses was reported as 12% in England (both NHS acute and non-acute), 6% in Northern Ireland, 8% in Scotland, 11% in Wales and 10% in England independent sector.
The vacancy rate for administrative and clerical staff in endoscopy was 10% in England NHS acute, 9% England NHS non-acute, 6% Northern Ireland, 14% Scotland, 7% Wales and 7% England independent sector.
Numbers of endoscopists of different backgrounds employed in different sectors and the average mean number of lists performed per week (in brackets)
Trainees in endoscopy
The number and location of trainees from different professional backgrounds is summarised in table 3.
Seventy-six per cent of the lists performed by the trainees in acute NHS services in England are training lists, and the remaining 24% are service lists. Similarly, 25% of the lists performed by trainees in Northern Ireland, 54% in Scotland and 44% of the lists done by trainees in Wales are training lists. In non-acute English NHS services. nearly all the lists performed by trainees are training lists with no service lists. These training lists typically have fewer patients (range between 5 and 9 points per list) than service lists (range between 10 and 14 points).
Dedicated training lists for trainees are provided in 96% (207/215) of acute NHS English services, 26% (9/34) in non-acute NHS English services, 56% (6/11) in Northern Ireland services, 60% (26/43) in Scottish services and 74% (14/19) in Welsh services.
Number of trainee endoscopists per sector and their backgrounds
Waiting times
A number of services reported difficulty in meeting national waiting time targets as seen in figure 3. Ninety per cent of units in Northern Ireland and 22% acute services in England failed to meet urgent non-cancer targets. Twenty per cent acute in English sectors, 42% in Welsh sectors and 40% in Scottish sectors failed to meet urgent cancer targets. Figure 3 summarises the number of services meeting national waiting targets over the 3 months up to April 2017. All data are given as percentage (%) of services. There was a statistically significant difference (p<0.001 χ2) between services meeting national waiting time for urgent cancer, urgent non-cancer, routine and surveillance among all the four nations. Please refer to the online supplementary file for further subgroup analysis between the different nations. The national targets are detailed as below.

Overview of the services across UK meeting national waiting time. NHS, National Health Service.
National target for urgent cancer and urgent non-cancer is within 2 weeks from the time of referral.
JAG requirement for non-urgent referrals
England: 6 weeks – routine and surveillance beyond due date.
Northern Ireland: 9 weeks – routine and surveillance beyond due date.
Scotland: 6 weeks – routine and surveillance beyond due date.
Wales: 8 weeks – routine and surveillance waits beyond due date.
On a scale of 1 (very pessimistic) to 10 (very optimistic), 12% (26/215) of acute English NHS services rated their optimism about meeting national waiting time targets over the next 1 year as 4 or less, and 53% (113/215) gave a rating of 7 or more. The responses were less favourable in the devolved nations. In Northern Ireland, 91% (10/11) gave a rating of 4 or less and only 9% (1/11) gave a score of 7 or above.
The biggest constraints to meeting waiting times are endoscopist capacity and recruitment, unplanned demand and nursing recruitment. Fewer services cited shortfalls with administrative staff. This is reinforced by 63% (133/215) of acute sites in England stating that they have a difficulty scale of 7 or more in recruiting endoscopists on a scale of 1 (no problem) to 10 (very difficult). Forty-eight per cent (104/215) of the same services rated the recruitment of nursing staff as scoring 7 or more on this scale.
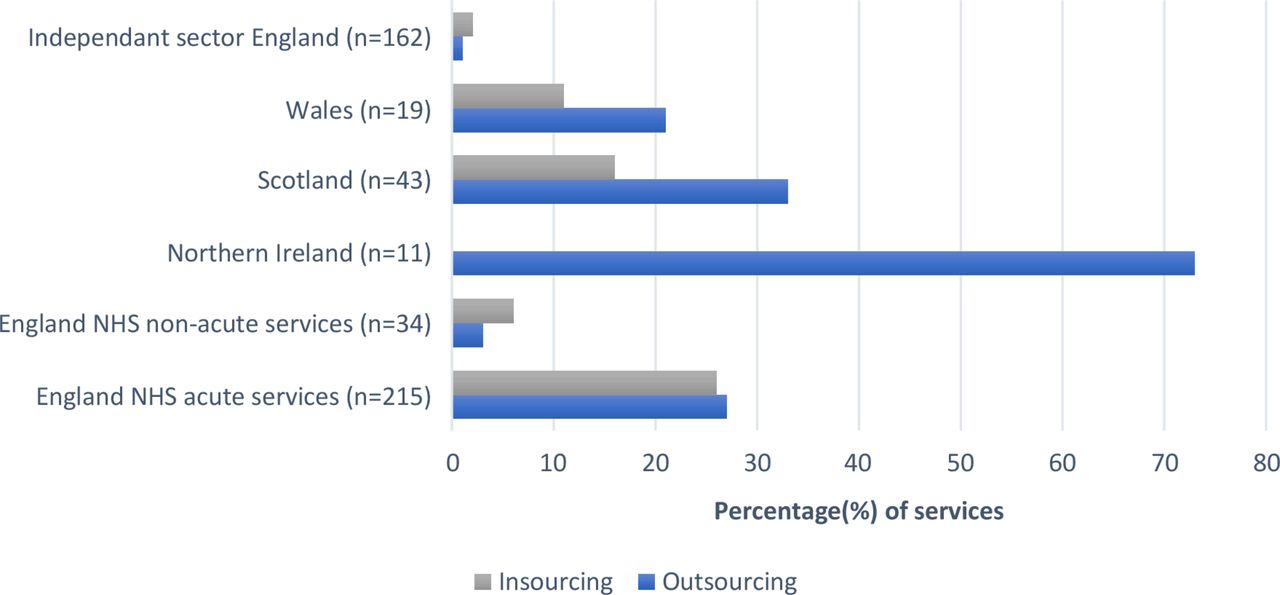
Many services were taking action to try and improve waiting times. Figure 4 summarises outsourcing and insourcing activity across various UK endoscopy services.
Twenty-seven per cent (59/215) of English acute NHS services ‘outsource’ patients to external providers, that is, arrange for them to have endoscopic procedures outside of their organisation.
Twenty-six per cent (55/215) of English acute NHS services ‘insource’ endoscopy services, that is, where an external provider team comes in to perform extra endoscopies within their facilities. This usually occurs during the weekend but can happen at other times.
Seventy-three per cent (156/215) of acute NHS services in England scored 7 or more when asked to rate how difficult it was to provide enough capacity to meet demand where 1 (no problem) and 10 (very difficult). Sixty-five per cent (105/162) of English independent sector services gave a score of 1.

Steps taken to improve waiting times: outsourcing and insourcing. NHS, National Health Service.
Productivity and efficiency
During 2016, many services introduced patterns of extended hours as part of the normal working week in order to increase capacity and maintain waiting times. Services are trying to increase capacity mainly by backfilling vacant lists. Ninety-seven per cent (209/215) of acute NHS services in England did this with 66% (142/215) of services doing this weekly. Eighty-two per cent (176/215) of English acute NHS services did ad hoc weekend work. Of these, 66% (121/215) worked most or every weekend. In the acute NHS sector, evening work was undertaken in 21% (46/215), regular 6 days working in 27% (58/215) and regular 7 days working in 16% (34/215) of services. Figure 5 summarises the methods taken by endoscopy services to increase capacity and maintain waiting times.
Capacity plans are strategies set out by endoscopy services for demand management, better resource utilisation and planning for future capacity requirements. Thirteen per cent (29/215) of acute NHS endoscopy services in England, 18% (2/11) in Northern Ireland, 44% (19/43) in Scotland, 16% (3/19) in Wales and 62% (100/162) of English independent sector units do not have an agreed capacity plan. Most services have data collection to look at productivity. However, routine data collection is not undertaken for demand and capacity in 1% (2/215), utilisation of lists in 7% (14/215) and utilisation of points2 in 9% (20/215) of NHS acute services in England. The number of endoscopies done on a list is calculated using a point system. A point is a unit of time, and typically one point is equivalent to 20 min. The data collection systems are less common in other nations. They are not undertaken for demand and capacity in 15% (5/34) of non-acute English services, 21% (4/19) of Welsh services, 5% (2/43) of Scottish services and 36% (59/162) of English independent services. Data collection for utilisation of lists is not undertaken in 26% (9/34) of non-acute services in England, 37% (4/11) in Northern Ireland, 16% (7/43) in Scotland, 47% (9/19) in Wales and 28% (46/162) in the England independent sector. Data collection for utilisation of points is not done in 29% (10/34) in the England NHS non-acute sector, 50% (5/10) in Northern Ireland, 18% (8/43) in Scotland, 26% (5/19) in Wales and 45% (73/162) in the English independent sector.
Eighty-nine per cent services perform between 10 and 14 points on a ‘service’ endoscopy list and 62% services between 5 and 9 points on a training list.
Figure 6 provides an overview of the DNA rates for standard lists and bowel cancer screening lists across UK. Did not attend (DNA) rates of more than 10% were recorded in 7% of acute NHS services in England, 9% in non-acute NHS services in England, 5% in Scotland and 16% in Wales. Fifty-five per cent of services in Northern Ireland had a DNA rate between 5% and 10%. It is recommended that all services should aim for a DNA rate of less than 5% to maximise efficiency. There was a statistically significant difference (p<0.001 χ2) between services who had DNA rates of >5% for standard lists across all the four nations. However, there was no statistical significance (p=0.096 χ2) between services who had DNA rate of >5% in bowel cancer screening programme lists across all the four nations. The DNA rates in Bowel Cancer Screening Programme (BCSP) services were remarkably lower compared with the standard lists. This is likely due to the vigilant and dedicated bowel cancer screening programme nurses, and their structured preassessment process and communication with patients about the procedure.

Methods to increase capacity and maintain waiting times. NHS, National Health Service.

Comparison of DNA rates between standard lists and BCSP lists across UK. BCSP, Bowel Cancer Screening Programme; DNA, did not attend; NHS, National Health Service.
Safety
An endoscopy safety checklist is used routinely throughout almost every service. A percentage of 99.5% (214/215) of acute NHS services in England, 91% (10/11) in Northern Ireland, 100% (19/19) in Wales, 88% (38/43) in Scotland and 95% (154/162) in the English independent sector use a safety checklist. The safety checklist is used in 91% of services as paper form, while 6% of services use an electronic platform. Seventy-one per cent of services audit the usage of these checklists.
Some endoscopy services are used periodically to house patients from the emergency department to support ‘flow’. This was reported in 13% (27/215) of acute services in England, 9% (4/43) of Scottish services, 16% (3/19) of services in Wales and 9% (1/11) of services in Northern Ireland. In most of these services, it occurred less frequently and very occasionally in response to a major incident.
Discussion
This survey provides a comprehensive overview of UK endoscopy services in 2017. It clearly shows how these services are under pressure with a significant number not meeting waiting time targets. This is a particular problem in the devolved nations where services struggle with patients who are referred other than ‘urgent suspected cancer’. There is room for an increase in 7-day working pattern to meet the increased demand, but evidence suggests that staffing would be a significant issue. It is imperative that meeting increased workload should not be at the detriment of quality, safety or training. Endoscopy services will need to continue to increase activity in order to meet the expected further rise in demand over the upcoming years. As well as increasing the number of procedure rooms, services will need to look at extending the hours they are working including the weekend. More staff need to be employed in all the roles that undertake and support endoscopy. In addition, there is clearly the need to maximise productivity and efficiencies—an area for sharing good practice and worthy of study. Our survey shows that there is an opportunity to reduce non-attendance rates by adopting the rigorous preassessment processes that are routine practice in the bowel cancer screening programmes.
The major constraints that services face is staffing issues mainly endoscopists, nursing and to a lesser degree administrative staff. Services also lack physical capacity to accommodate growing demand. Approximately a quarter of services are paying for both insourcing and outsourcing of patients, at significant cost to the service. This is needed despite backfilling and weekend working being normal practice in nearly two-third of the NHS units.
Some services, particularly those outside of the English NHS system, do not have a capacity plan or assess demand and capacity, utilisation of lists or the utilisation of points. Using a capacity plan will help to support planning and maintain short waiting times. Routine data collection should be done in all services, which is a further vital activity allowing objective performance management, improved productivity and ultimately enhanced capacity. Instead of becoming ‘reactive’ to historical demand, services should be proactive and monitor demand regularly.2
It is worth noting that in this climate of ever-expanding demand across the NHS, endoscopy services overall, have performed remarkably well. NHS endoscopy services are seen as world-leading with respect to quality and efficiency, and staff should feel justly proud of their achievements, delivering ever-increasing activity with higher levels of clinical quality and patient satisfaction.4
The survey from the last 2 years were designed to cover aspects of bowel cancer detection (2015) and Endoscopic ultrasound(EUS)/Endoscopic retrograde cholangiopancreatography (2016), but there were few areas about service activity that were common to all three surveys. Only questions that were in all three census years were analysed. To be included in this part of the analysis, units had to have responded to the questions in all three census years. Eighty-three per cent of the acute NHS services, 61% of the non-acute NHS services in England, 63% of the services in Northern Ireland, 40% in Scotland, 68% in Wales and 57% of the services in independent sectors completed all the censuses between 2015 and 2017. In 2015, the difference in the amount of outsourcing activity approached statistical difference (p=0.056 χ2) among the different nations and achieved a significant difference in 2016 (p=0.033 χ2) and 2017 (p<0.001 χ2), respectively. It is noteworthy that there is a stepwise increase in statistically significant use of outsourcing between 2015 and 2017 across the nations. This is probably because of a remarkable increase in the outsourcing activity in Northern Ireland and Scotland and to a lesser extent in the acute NHS units in England. There was an appreciable difference (p<0.001 χ2) between the four nations who reported difficulty to meet service demand in all the 3 years. Some services seem to meet the demand better than the others, and it remains varied. Services in Northern Ireland and Scotland reported significant difficulty to meet demand despite the increase in outsourcing activity. The survey in previous years did not compare the parameters focused in the 2017 census. It may be of interest to continue to include the service activity, pressure and workforce related questions in future surveys to better understand the gaps and plan service delivery. This may pave the way for recruitment drives for better staffing to meet the growing demand and to improve patient satisfaction.
Endoscopy services will continue to struggle to meet national waiting time targets unless new practices are adopted. They will need to increase capacity by attracting and retaining endoscopists, nurses and support staff. They must optimise productivity to make them as efficient as possible in the current constrained financial environment. Faecal calprotectin in young adults has been shown to accurately distinguish inflammatory bowel disease from functional gut disorder, thereby reducing secondary care referrals and diagnostic health costs.13 There is growing evidence of the benefits of using the Faecal Immunochemical Test (FIT) over the presently used guaiac Faecal Occult Blood Test (gFOBT).14 FIT is sensitive to much lower concentrations of blood than gFOBT and therefore can detect cancers and significant colonic lesions more reliably and at an earlier stage. By increasing the number of referrals, the use of FIT could increase pressure on an already stretched colonoscopy service. However, by adjusting the cut-off of FIT positivity, the referral rate can be adjusted so that it is appropriate for the available colonoscopy resource.15 The Scottish BCSP has started using FIT from November 2017.16 From 2018, FIT will be used as the primary screening test for bowel cancer screening across the whole of UK.17 This will provide the opportunity to see how demand for diagnostic colonoscopy can be managed using FIT in patients with lower gastrointestinal symptoms as well as a review of the current guidance for surveillance. Newer developments such as colon capsule endoscopy and nasoendoscopy seem very promising, but whether they would help reducing the pressure on our services needs further study and research.
The data from this survey are of interest to all who work in endoscopy and give a useful ‘state of the nation’ detailing waiting times and working practices.
Supplementary file 2
![[SP2.jpg]](https://fg.bmj.com/content/flgastro/10/1/7/DC2/embed/inline-supplementary-material-2.jpg?download=true)
Supplementary file 3
![[SP3.jpg]](https://fg.bmj.com/content/flgastro/10/1/7/DC3/embed/inline-supplementary-material-3.jpg?download=true)
Supplementary file 4
![[SP4.jpg]](https://fg.bmj.com/content/flgastro/10/1/7/DC4/embed/inline-supplementary-material-4.jpg?download=true)
Supplementary file 5
![[SP5.jpg]](https://fg.bmj.com/content/flgastro/10/1/7/DC5/embed/inline-supplementary-material-5.jpg?download=true)
Acknowledgments
We would like to thank Mr Steven Wyatt, Head of Strategic Analytics, Strategy Unit and
Mrs Sarah Jackson, Healthcare Analyst at the Strategy Unit.
Footnotes
Contributors JTG and LS: wrote the manuscript and incorporated comments of all coauthors. ST-G, JS, DJ and TS: reviewed the manuscript and provided comments based on their knowledge of JAG and endoscopy services. RB and MD: data processing from the survey and reviewed the manuscript. HNH: assisted with statistical analysis of the data and reviewed the manuscript. The contents of the manuscript are our original work and are not under consideration for publication elsewhere. We have adhered to the ICMJE criteria for authorship and have followed the journal guidelines for manuscript development. All authors have read and approved this version of the manuscript.
Funding This research received no specific grant from any funding agency in the public, commercial or not-for-profit sectors.
Disclaimer Except for the removal of clear outliers which resulted from erroneous data entry, all data are as reported by services.
Competing interests None declared.
Patient consent Not required.
Provenance and peer review Not commissioned; externally peer reviewed.
Correction notice This article has been corrected since it published Online First. Affiliations 5 and 6 have been corrected.