Article Text

Abstract
Problem In 2010, there was a significant waiting list for admission to the intestinal failure unit (IFU) at the Salford Royal National Health Service (NHS) Foundation Trust. There had been a steady increase in the number of new patients referred to the IFU (89 patients 2005; 152 patients 2012) and the number of established patients requiring home parenteral nutrition (HPN) (135 patients 2005; 206 patients 2012) over the last decade. The impact of the resulting long waiting list for these complex patients was that patient deaths occurred in those awaiting admission.
Design Continuous improvement methodology using the model for improvement and sequential plan–do–study–act cycles.
Setting Salford Royal NHS Foundation Trust IFU; a large NHS teaching hospital in Northwest England.
Key measures for improvement The primary outcome measures were inpatient length of stay and time spent on waiting list prior to admission.
Strategies for change A continuous improvement programme, supported by a project manager.
Results There has been a 21% reduction in average length of stay on the IFU from 55.7 to 44.0 days and a reduction of 72% in the average length of time new patients spent on the waiting list for admission from 65.7 to 18.5 days. These changes were associated with concomitant reduction in 30-day readmission rate from 12.1% to 4.5% and early suggestions of reduced inpatient and waiting list mortality.
Conclusions It is possible to improve the efficiency of a large national service for complex patients using quality improvement methodology, resulting in improved access and reduced waiting list mortality.
- INTESTINAL FAILURE
- NUTRITION
Statistics from Altmetric.com
Outline of problem
Intestinal failure (IF) represents a spectrum of conditions that encompass both acute and chronic pathologies. Traditionally IF is divided into three broad groups. Type 1 IF is a relatively common, self-limiting problem that occurs following abdominal surgery; services for this group of patients are provided routinely by all hospitals undertaking surgery. However, Types 2 and 3 IF are much less common and care is usually within the remit of specialist units. Type 2 IF occurs in severely ill patients who develop septic, metabolic and nutritional complications following gastrointestinal surgery: these patients need multidisciplinary input and nutritional support to facilitate recovery. Type 3 IF is chronic IF requiring long-term nutritional support, usually home parenteral nutrition (HPN).1
The annual British artificial nutrition survey reported that 624 adult patients with IF had been receiving HPN in 2010.2 Services for the small group of patients requiring HPN were subject of a national review in 2007, which resulted in the publication, in 2008, of ‘A Strategic Framework for Intestinal Failure and Home Parenteral Nutrition Services for Adults in England’.3 This framework highlighted the need for services to ‘use resources appropriately and effectively’ and ‘foster equity of access’. Units were to apply to become accredited HPN centres, resulting in devolution of specialist care into multiple smaller units, to provide more local access for patients.
This reconfiguration of services motivated the Salford team to conduct a rigorous assessment of its own systems and processes in order to be able to demonstrate both a high quality and cost effective service. As part of this review, many areas for improvement in patient flow were identified with the potential to improve access to the unit.
Design
Location
Salford Royal National Health Service (NHS) Foundation Trust is an acute university teaching hospital in the North West of England with 850 beds providing care for approximately 320 000 inpatients per year. In addition to providing local services, the hospital provides tertiary care for renal medicine, neurosciences and complex spinal surgery. The hospital also hosts one of two national centres for IF. The intestinal failure unit (IFU) admits patients from across the UK, and sometimes beyond, and provides highly specialist medical and surgical care. The core clinical members of the IFU's multidisciplinary team and their working practice are summarised in table 1.
Core intestinal failure unit (IFU) multidisciplinary team (MDT) membership
Improvement programme
The IFU underwent some changes in infrastructure between September 2009 and September 2010, prior to the project formally commencing. This included a change in consultant job plan that enabled enhanced consultant physician presence on the IFU, facilitating daily contact with the rest of the IFU team for review of patients as required as well as bi-weekly formal ward rounds. In addition, this consultant had experience of quality improvement methodology and was trained on the Trust's Clinical Quality Academy programme. During this time, regular quality meetings were convened and early process mapping commenced to outline a typical patient pathway from referral to discharge.
The IFU applied for Quality Improvement, Development and Initiative Scheme (QIDIS) funding in 2010. QIDIS forms part of the NHS specialist service-commissioning framework and is similar to the Commissioning for Quality and Innovation (CQUIN) system operating in standard NHS care services. The team's bid was successful and funding granted to support the improvement programme. This allowed the employment of a dedicated project manager who collected and collated accurate data for the project.
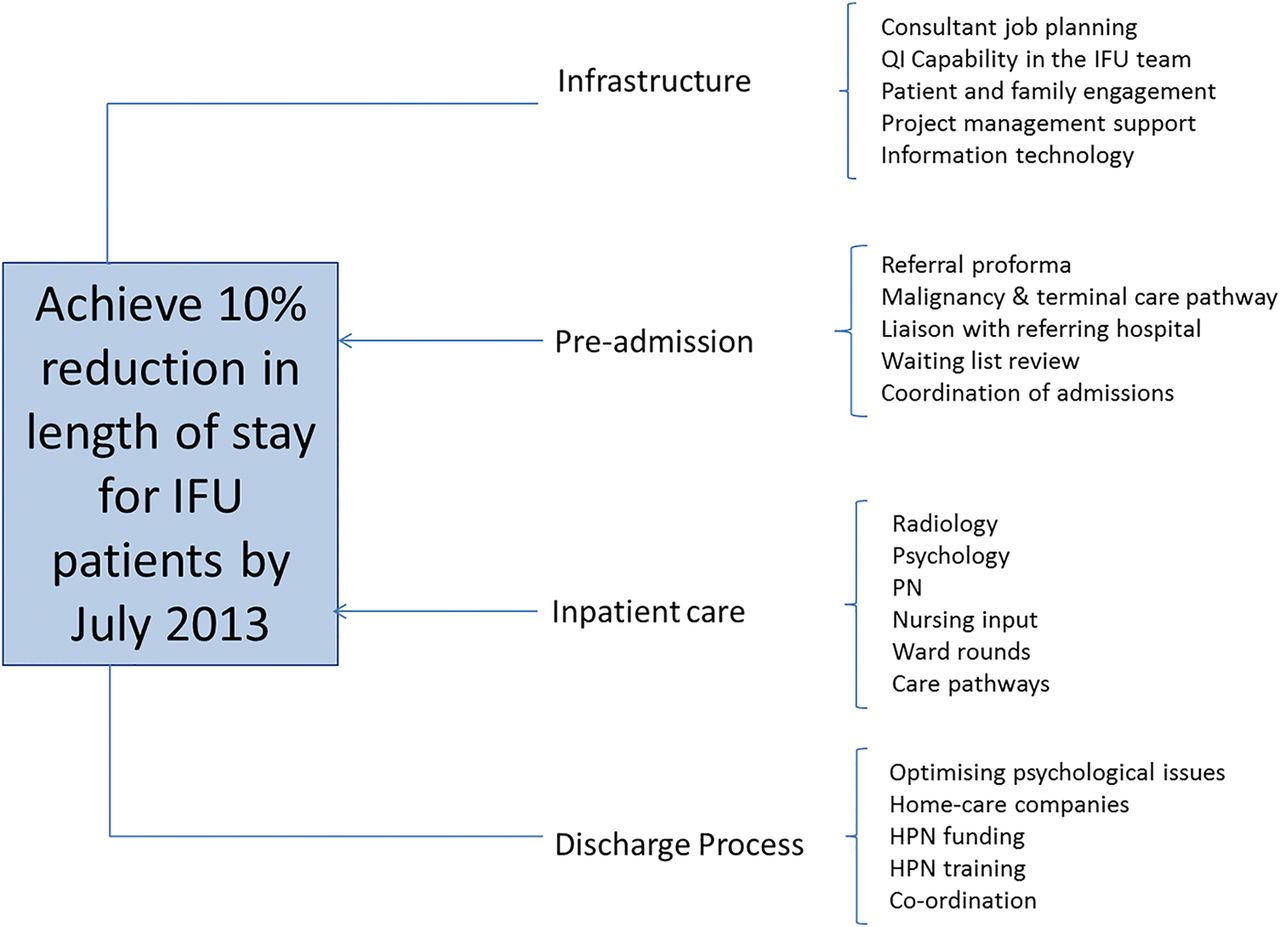
The project was developed using the model for improvement (figure 1). The team generated a driver diagram (figure 2) to articulate both the aim of the project and develop a measurement strategy. Team members were also able to identify areas within the secondary drivers in which to conduct plan–do–study–act cycles to test ideas for change. The IFU improvement team met on a weekly basis to review the data and the tests of change in order to ensure a rapid progression through testing to implementable solutions. These meetings also enabled all staff to feel engaged with the project work and understand the data presented.

The model for improvement—used as a framework on which to base the improvement project—adapted from ‘The Improvement Guide’4 and used with permission of the authors.

A driver diagram demonstrating the project aim and the primary and secondary drivers of improvement.
Key measures for improvement
The primary outcome of interest was a reduction in the length of stay of patients on the IFU.
A further outcome of interest was the impact of this improved inpatient efficiency on the care of patients waiting in referring hospitals for admission to the IFU: both time spent waiting and mortality on the waiting list.
Measures of inpatient mortality and readmissions were monitored as balancing measures to ensure no unforeseen detriment to the existing service.
Process of information gathering
Data were collected continuously and collated in Microsoft Excel spreadsheets. The generation of Statistical Process Control charts provided information about system variation; extreme variation is interpreted as ‘special cause’ variation in the system (see online supplementary appendix 1). In addition to the key flow data, such as length of stay and referral times, process data were also collected, such as time to intravenous feeding line insertion and time spent on ward rounds, when looking to streamline specific areas of practice.
Data analysis
Data were analysed using statistical process control charts produced using QI Macros (KnowWare International, INC 2696 S. Colorado Blvd St, Ste 555 Denver, Colorado, USA).  charts of monthly length of stay and time on waiting list data were produced in a setting where the time order of the subgroups was preserved and the subgroup size was variable. X charts were used to plot the number of referrals and the number of inpatient deaths each year. P charts were used to review the proportion of patients dying on the admission waiting list and the proportion of discharged patients readmitted within 30 days. A rare event G chart was also used to monitor the number of successful discharges between inpatient deaths. σ Limits radiating from each centre line produced upper control line and lower control line control limits. Shifts were determined ‘a priori’ according to standard operating principals for special cause variation (see online supplementary appendix 1).
Reduction in length of stay
The percentage reduction in length of stay was calculated by comparing the average length of stay during a time where the process was stable (ie, showing only normal variation) with the baseline. Baseline data were collected from April 2008 to April 2011 when the improvement work began. Subsequent data were compared with this baseline.
Implemented changes
The changes designed, tested and implemented are described in table 2.
Areas of improvement activity during the project divided by primary driver and additional structural interventions
Effects of change
Data analysis confirmed that there has been a steady increase in the number of patients referred to the IFU, with a particularly sharp increase over the past 2 years (figure 3). Referral and admission criteria to the IFU remained unchanged throughout the study period. The increase in referral rate supported the notion that, in order to meet this increased service demand, significant efficiency gains would be required.

X chart illustrating the rise in referrals to the intestinal failure unit (IFU) each year, with a steep rise over the past 4 years.
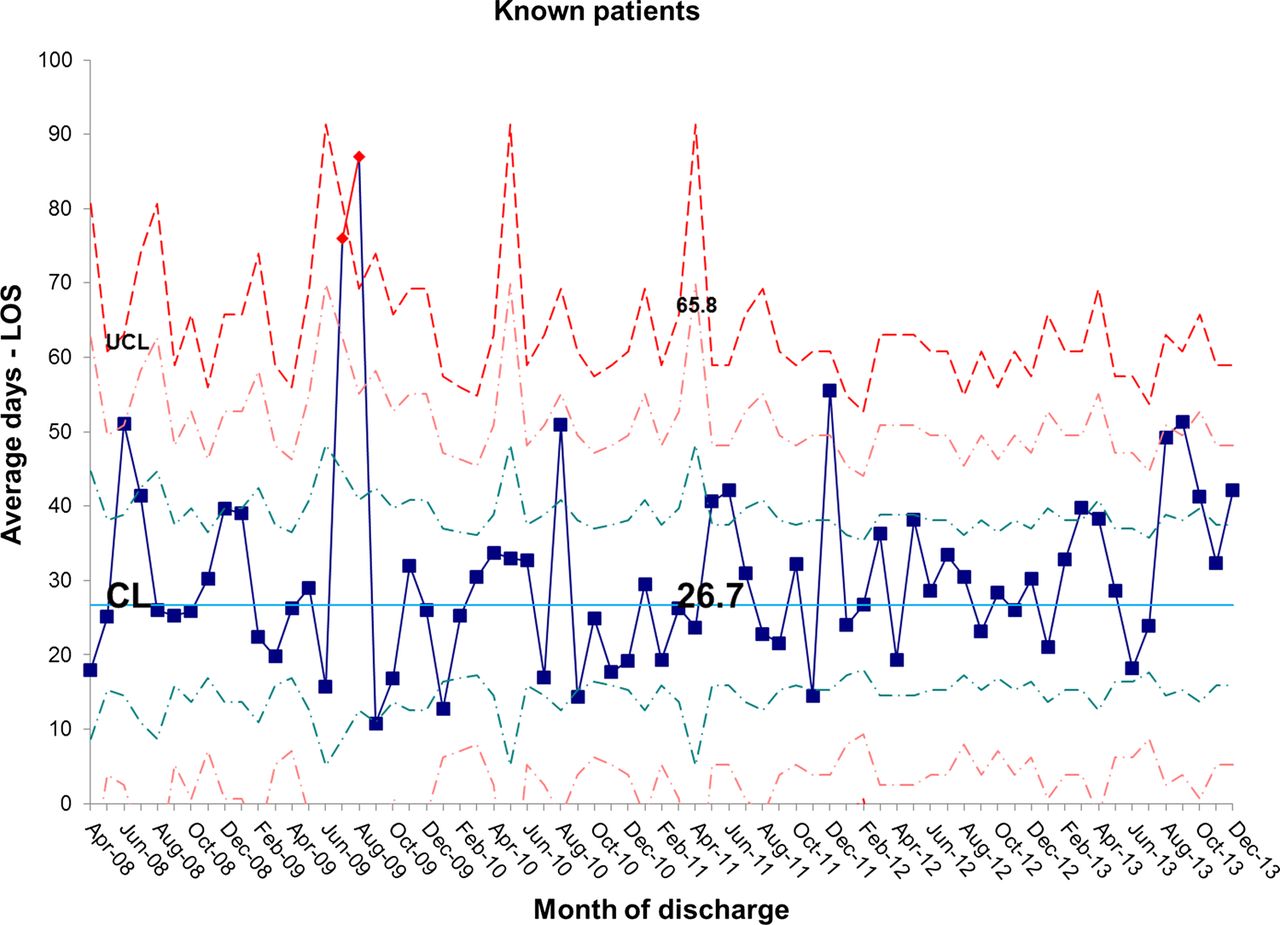
The length of stay for all patients admitted to the IFU at baseline was 55.7 days. There was a shift identified from May 2012 that has remained stable until the most recent data in December 2013. The new average length of stay for all IFU patients is 44.0 days (figures 4 and 5). This represents a 21% reduction in average length of stay on the IFU. Figures 6 and 7 demonstrate that the main reduction in length of stay occurred for new patients admitted to the IFU. The length of stay of patients known to the unit (eg, those requiring long-term HPN readmitted for management of complications) remained constant (figures 8 and 9).
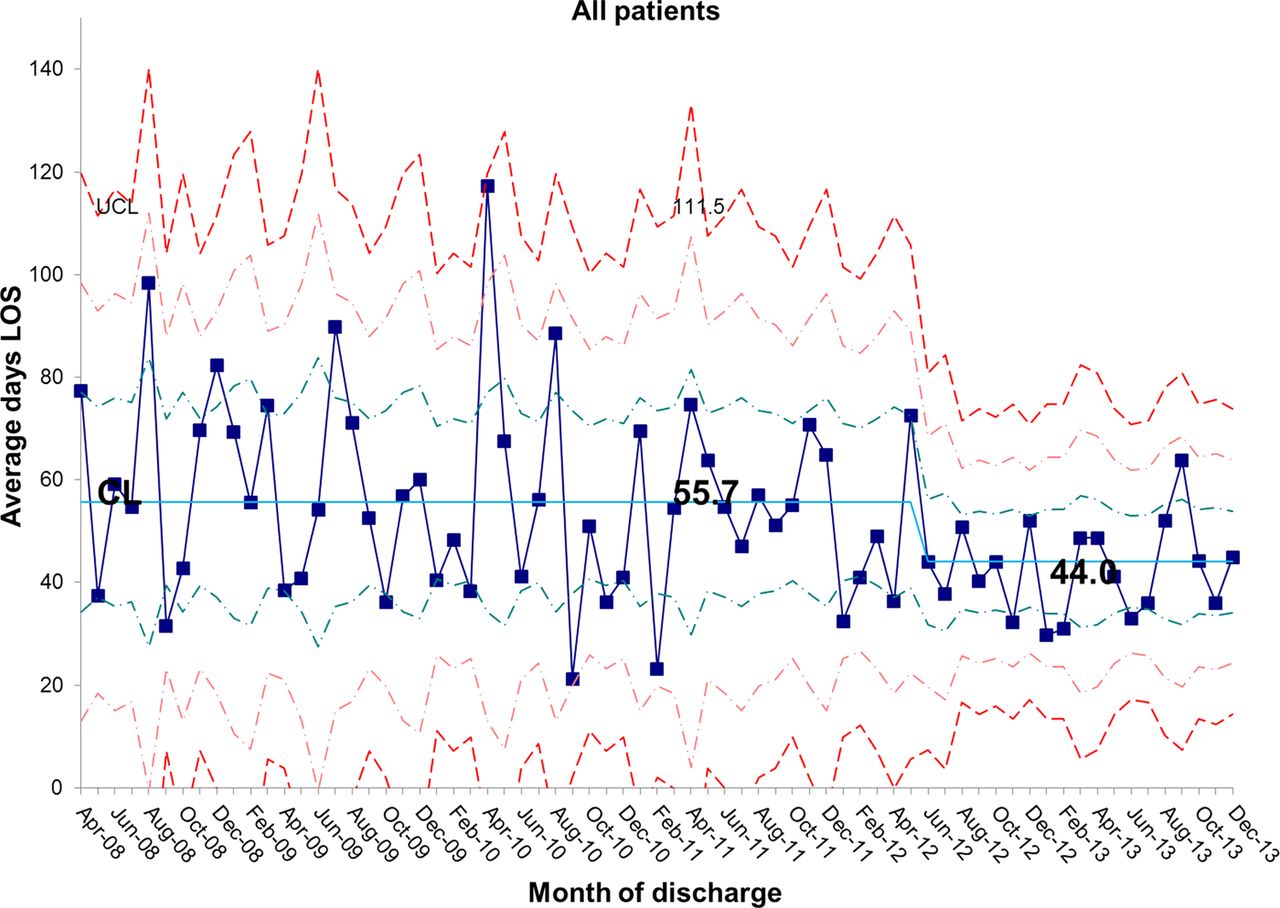
 chart showing sustained reduction in length of stay (LOS) for all inpatients and a reduction in the variation around the mean length of stay. CL, centre line; UCL, upper control line.

S chart showing sustained reduction in length of stay (LOS) for all inpatients and a reduction in the variation around the mean length of stay. CL, centre line; UCL, upper control line; LCL, lower control line.

 chart showing sustained reduction in length of stay (LOS) for new inpatients and a reduction in the variation around the mean length of stay. CL, centre line; UCL, upper control line.

S chart showing sustained reduction in length of stay (LOS) for new inpatients and a reduction in the variation around the mean length of stay. CL, centre line; UCL, upper control line.

 chart showing stability in length of stay (LOS) for known inpatients and variation around the mean length of stay. CL, centre line; UCL, upper control line.
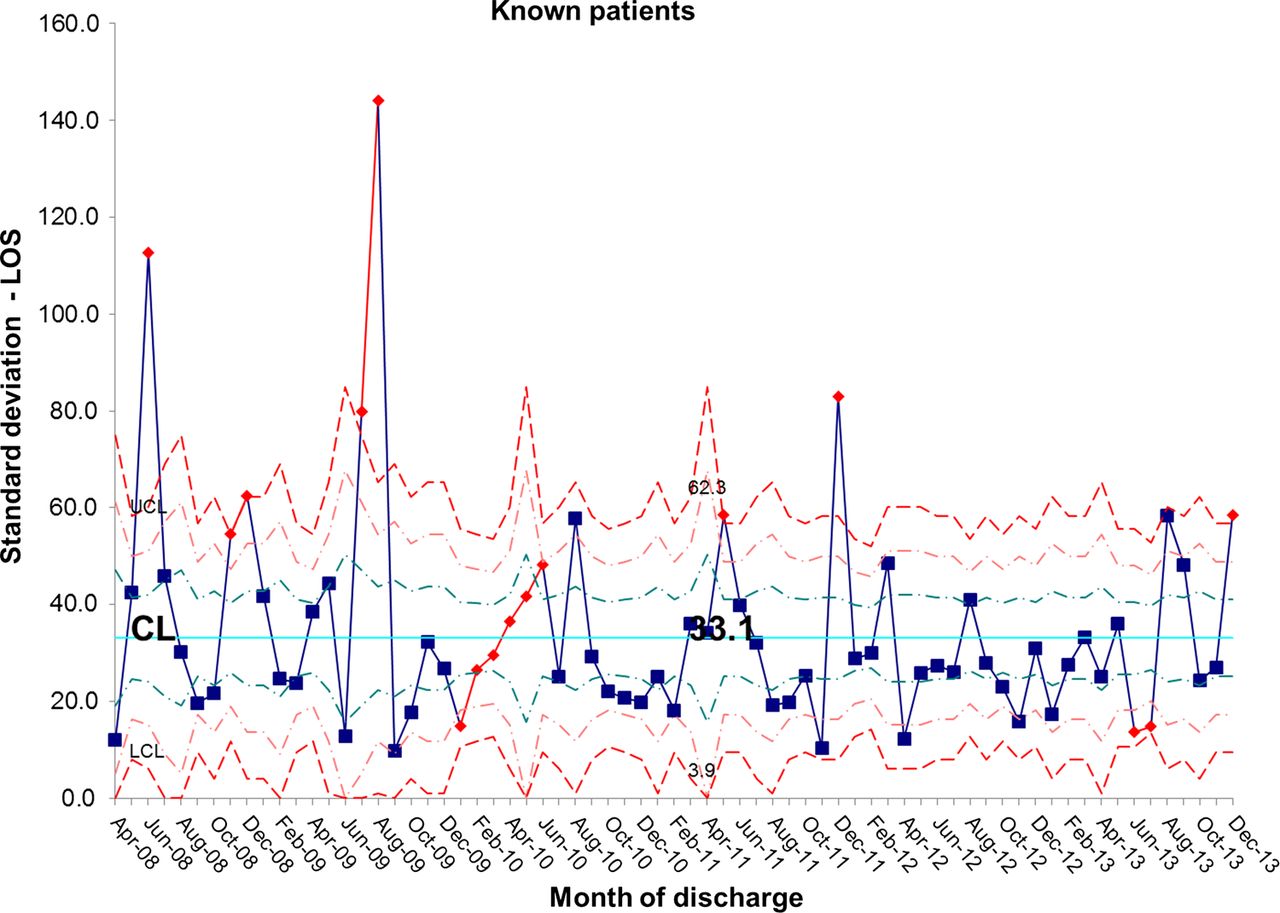
S chart showing stability in length of stay (LOS) for known inpatients and variation around the mean length of stay. CL, centre line; UCL, upper control line; LCL, lower control line.
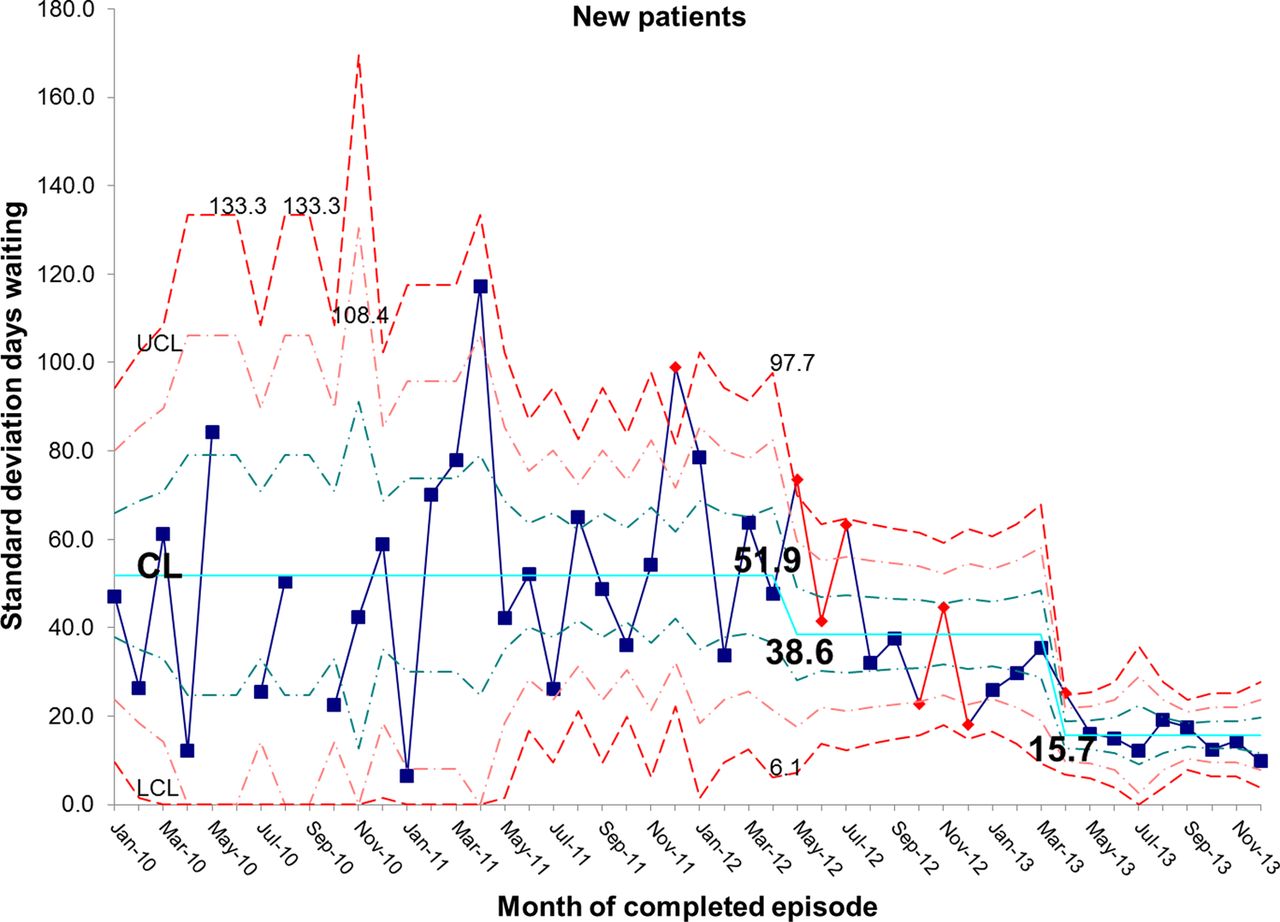
There has been a resultant decrease in the average length of time spent by new patients on the waiting list for admission. At baseline, the average wait was 65.7 days and is now 18.5 days, representing a reduction in waiting time of 72% (figures 10 and 11). In addition, the average length of time spent by known patients on the waiting list for admission also reduced significantly over the study period (figures 12 and 13).
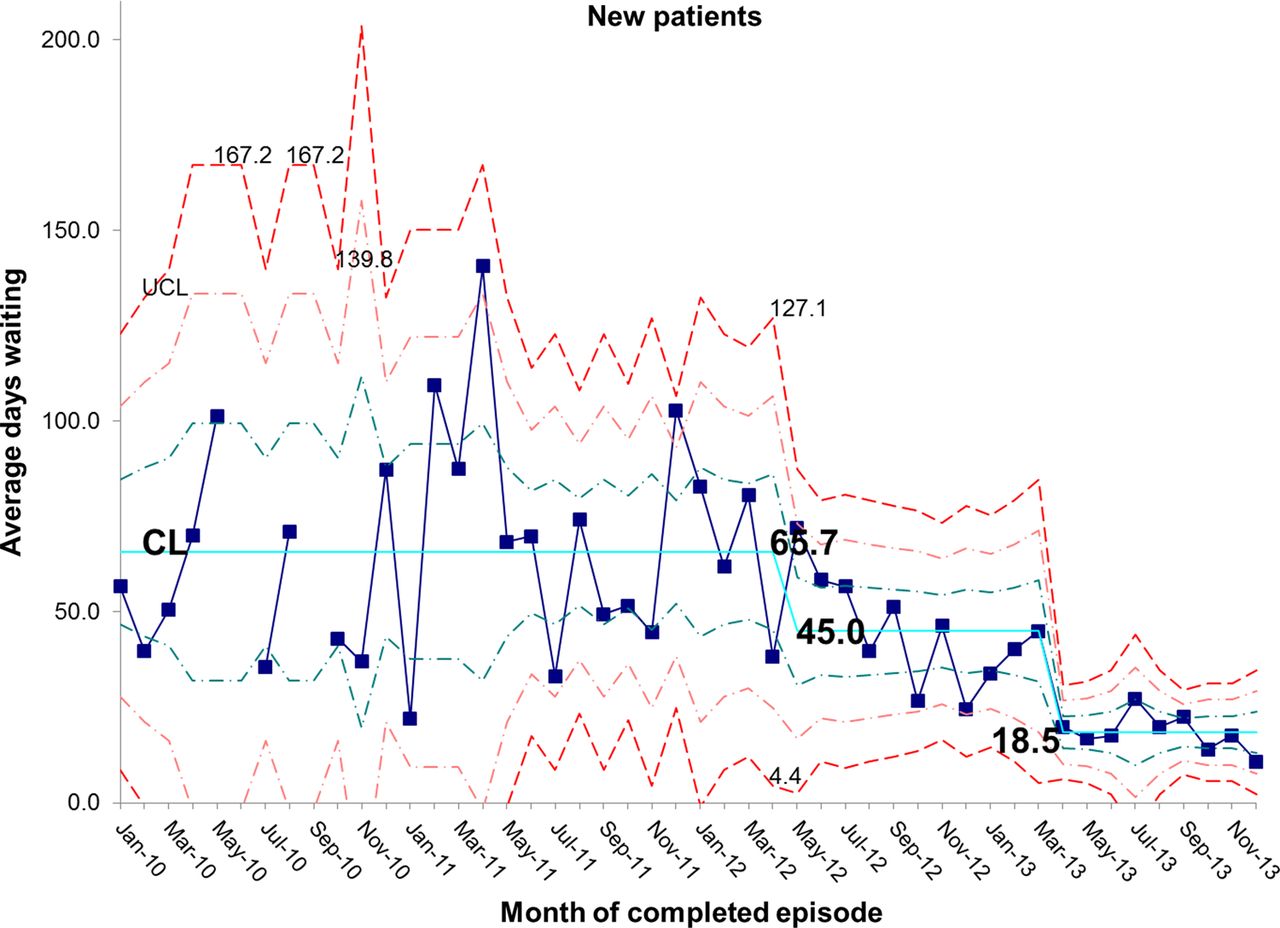
 chart demonstrating the reduction in average days spent on the waiting list for new patients awaiting admission to the intestinal failure unit. CL, centre line; UCL, upper control line.

S chart demonstrating the reduction in average days spent on the waiting list for new patients awaiting admission to the intestinal failure unit. CL, centre line; UCL, upper control line; LCL, lower control line.

 chart demonstrating the reduction in average days spent on the waiting list for known patients awaiting admission to the intestinal failure unit. CL, centre line; UCL, upper control line.
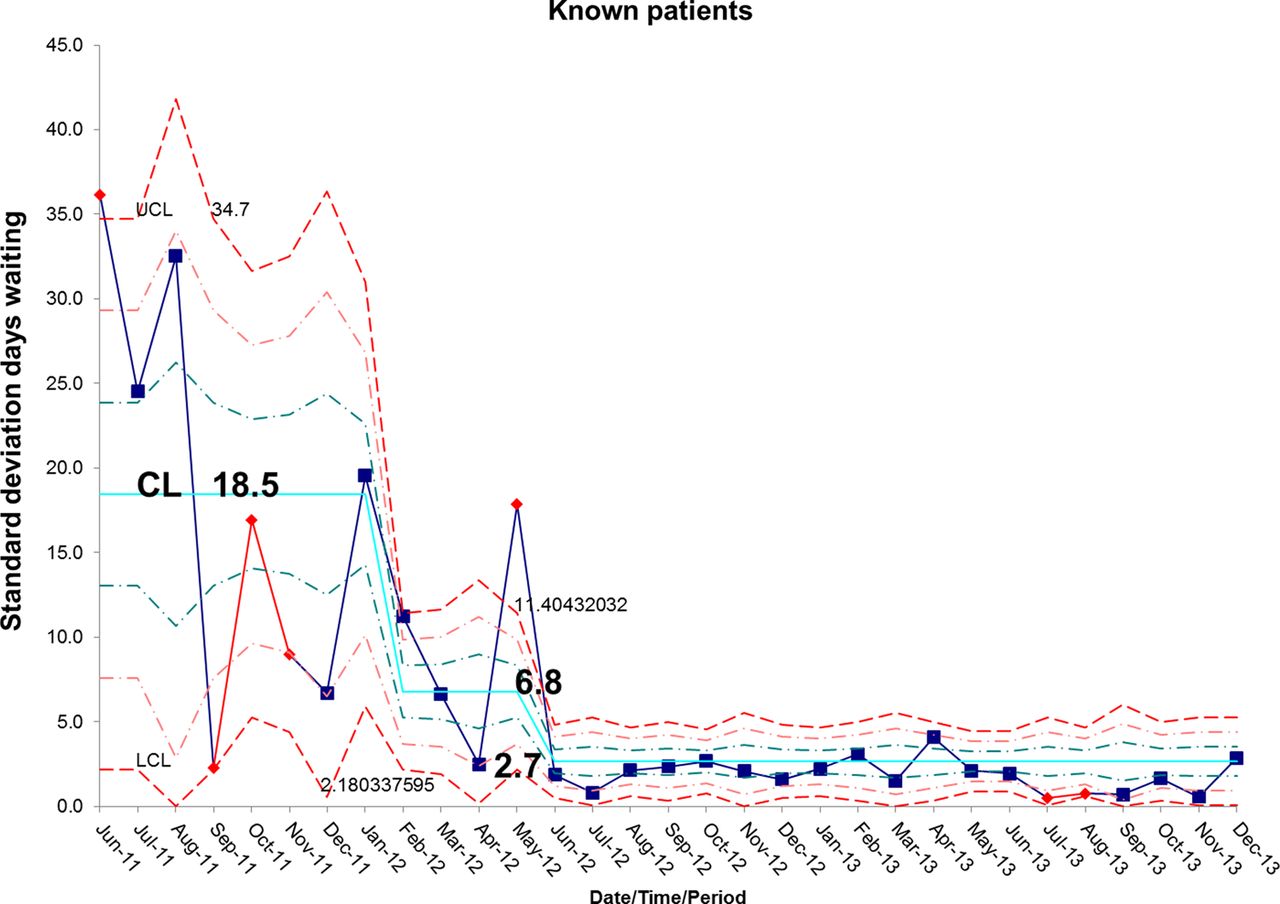
S chart demonstrating the reduction in average days spent on the waiting list for known patients awaiting admission to the intestinal failure unit. CL, centre line; UCL, upper control line; LCL, lower control line.
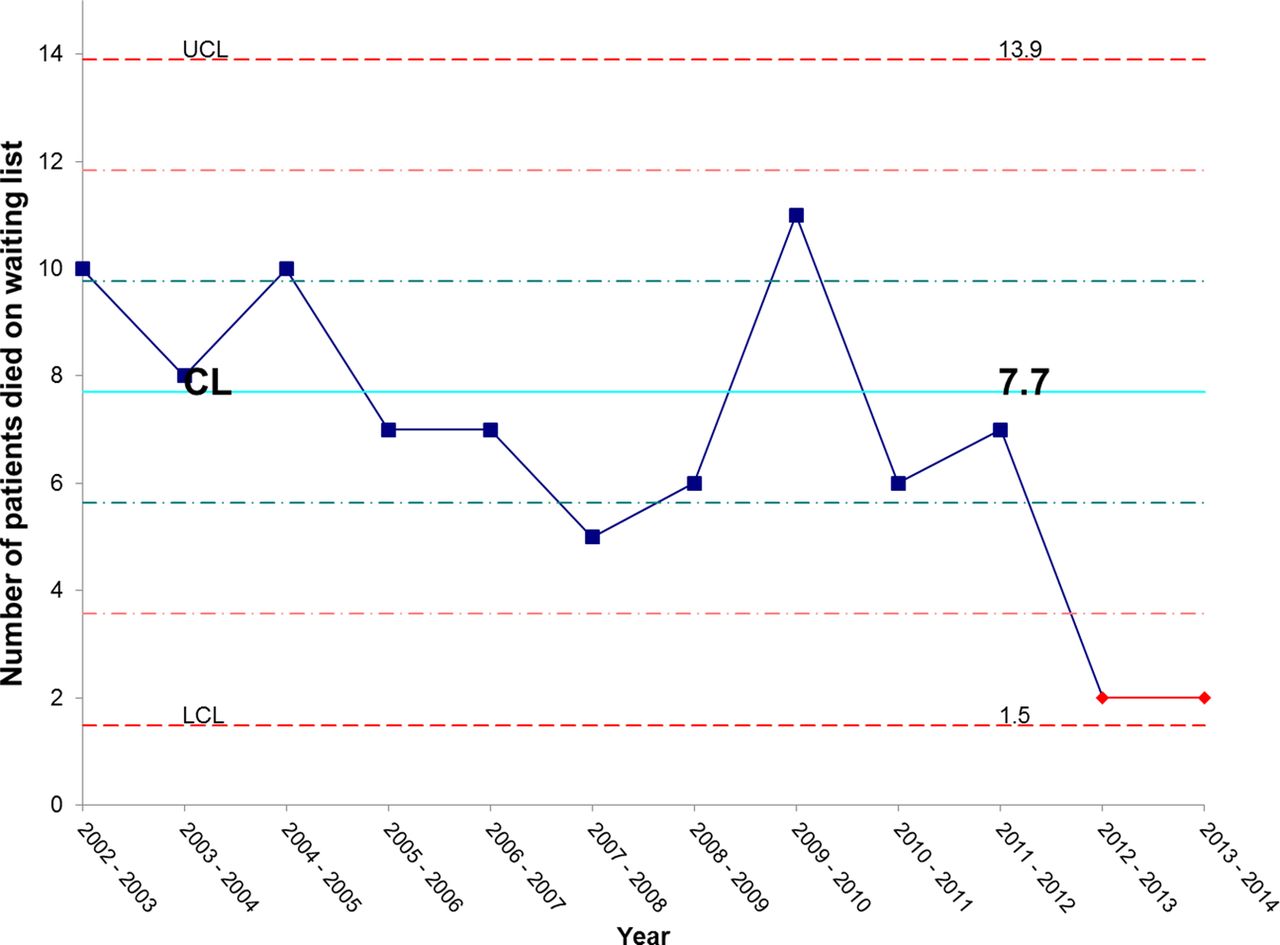
Figure 14 shows that there has been an unexpectedly low proportion of patients dying while waiting for admission over the past 2 years. We continue to monitor this but are hopeful that this represents early evidence of mortality benefits from our improved IFU efficiency.

X chart showing special cause (an unusually low number) of patients dying on the waiting list for admission in the past 2 years. CL, centre line; UCL, upper control line; LCL, lower control line.
During the project, we monitored inpatient mortality and 30-day and 60-day readmissions as balancing measures. Figure 15 shows that the number of inpatient deaths has not increased and may even have started to fall. These data are further supported by a sustained increase in the number of complete discharge episodes between inpatient deaths (figure 16). Furthermore, surgical activity remained stable during the study period at an average of 2.3 surgeries per month and 30-day readmissions did not increase; in fact, the proportion of patients readmitted within 30-days actually fell from 12.1% to 4.6% (figure 17).

X chart showing that there has been no adverse effect on inpatient mortality. Inpatient mortality may in fact be showing some early signs of improvement. CL, centre line; UCL, upper control line.
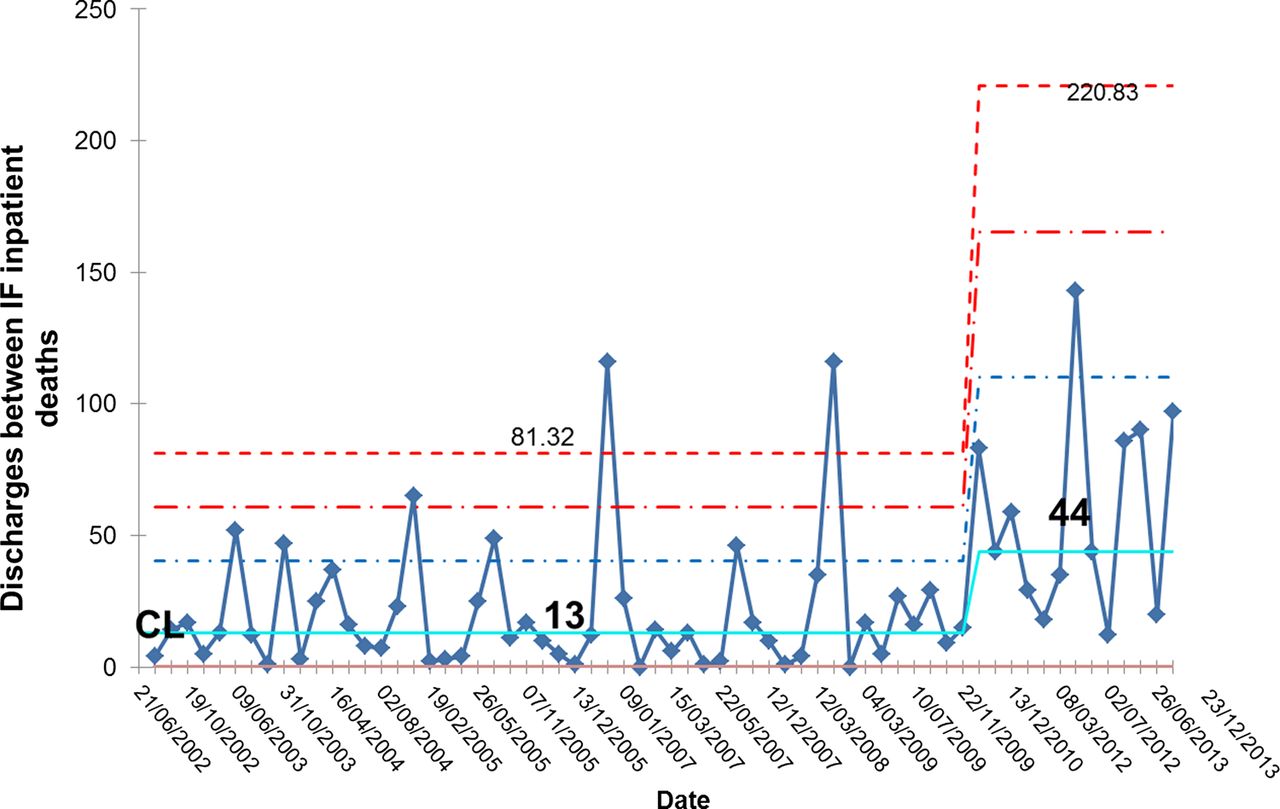
G chart showing that there has been an increase in the number of successful discharges between inpatient deaths providing further indication of a favourable impact on mortality reduction. IF, intestinal failure; CL, centre line.

P chart showing that despite the reduction in length of stay and overall increase in activity there has been no increase (in fact, there is a reduction) in 30-day readmissions following discharge from intestinal failure unit. CL, centre line; UCL, upper control line.
Lessons learnt
It is possible to improve the efficiency of a large national centre dealing with highly complex medical and surgical patients.
Improvements in inpatient efficiency can reduce waiting times for admission, thus improving access and reducing waiting list mortality.
The improvements in efficiency can be achieved without compromising patient safety.
Improved patient care packaging can lead to reduced readmission rates.
Team ownership of data is crucial. By reviewing the data weekly, the entire IFU team developed an increased awareness of their performance. This regular, team driven measurement was crucial in maintaining enthusiasm.
A dedicated project manager to assist in data collection and meeting management proved invaluable in maintaining progress.
Senior leadership is critical in achieving a successful outcome.
Discussion
We have shown that a centralised provider of a specialist service can make significant improvements in efficiency that directly results in improved patient outcomes.
The changes we have tested are not prescriptive and we did not set out to discover which particular change led to improvement. Rather, we saw them as a package of multiple small changes contributing to the whole. The changes could have applicability in other inpatient settings, both specialist and non-specialist; however, they should be tested within those settings rather than simply adopted from this study. It is important that other units use the model for improvement in order to develop system changes that are relevant to their own local practice.
Since it was already clear that new patients had much longer lengths of stay than those already known to the unit when readmitted with complications, this improvement work focused principally on reducing the length of stay in the former group. Indeed, by doing so, we were able to reduce the waiting time for admission for both new and known patients considerably. Ongoing work will evaluate whether novel tests of change (eg, further reduction in the duration of antibiotic salvage for infected central venous catheters in known patients requiring HPN) will reduce the length of stay of patients readmitted to the IFU with complications.
We cannot exclude an alternative cause of reduced mortality on the waiting list, but have not identified a change in the acuity of admissions or level of dependency that might account for the change.
Large centralised services for rare conditions have the advantage of having ready access to multiple specialists and a wealth of experience that smaller services may not be able to achieve. This study demonstrates that a centralised provider can also be agile and efficient and improve continuously to best deliver that expertise to patients.
Next steps
The IFU team are continuing their improvement work with a focus on patient experience and are working to develop the outpatient service and a patient access e-portal system. Following a successful peer review visit, the IFU is now disseminating its improvement work and working with other IF providers to share best practice and develop a coordinated care network for these complex patients.
Conclusions
A quality improvement model is an effective means of improving efficiency in an NHS hospital. We demonstrate that, in this quality improvement project, the IFU achieved significant, sustained reductions in inpatient length of stay resulting in improved access to the service, reduced waiting times and fewer deaths on the waiting list.
Key messages
What is already known on this topic?
There can be a significant waiting time for admission to specialised services.
What this study adds?
It is possible to improve the efficiency of a large National service for complex patients using quality improvement methodology.
How might it impact on clinical practice in the foreseeable future?
Centralised providers can utilise the methodology from this study to improve access to their services.
Supplementary materials
Supplementary Data
This web only file has been produced by the BMJ Publishing Group from an electronic file supplied by the author(s) and has not been edited for content.
Files in this Data Supplement:
- Data supplement 1 - Online supplement
Footnotes
Contributors SL conceived the project. All members of the team developed and worked on this work. ED, SL, MT drafted the paper; all authors commented on and approved the final version.
Funding The work was part of a programme of service improvement (Quality Improvement, Development and Initiative Scheme) supported by the National Commissioning Group. The NCG had no role in the design collection, analysis and interpretation of the data; in the writing of the report; and in the decision to submit the paper for publication.
Competing interests None.
Ethics approval This paper describes a process continuous improvement in the delivery of a National Intestinal Failure service, as a service improvement study, which does not require ethics approval.
Provenance and peer review Not commissioned; externally peer reviewed.